How to Build a Sales Dashboard App with Bubble
7 min
read
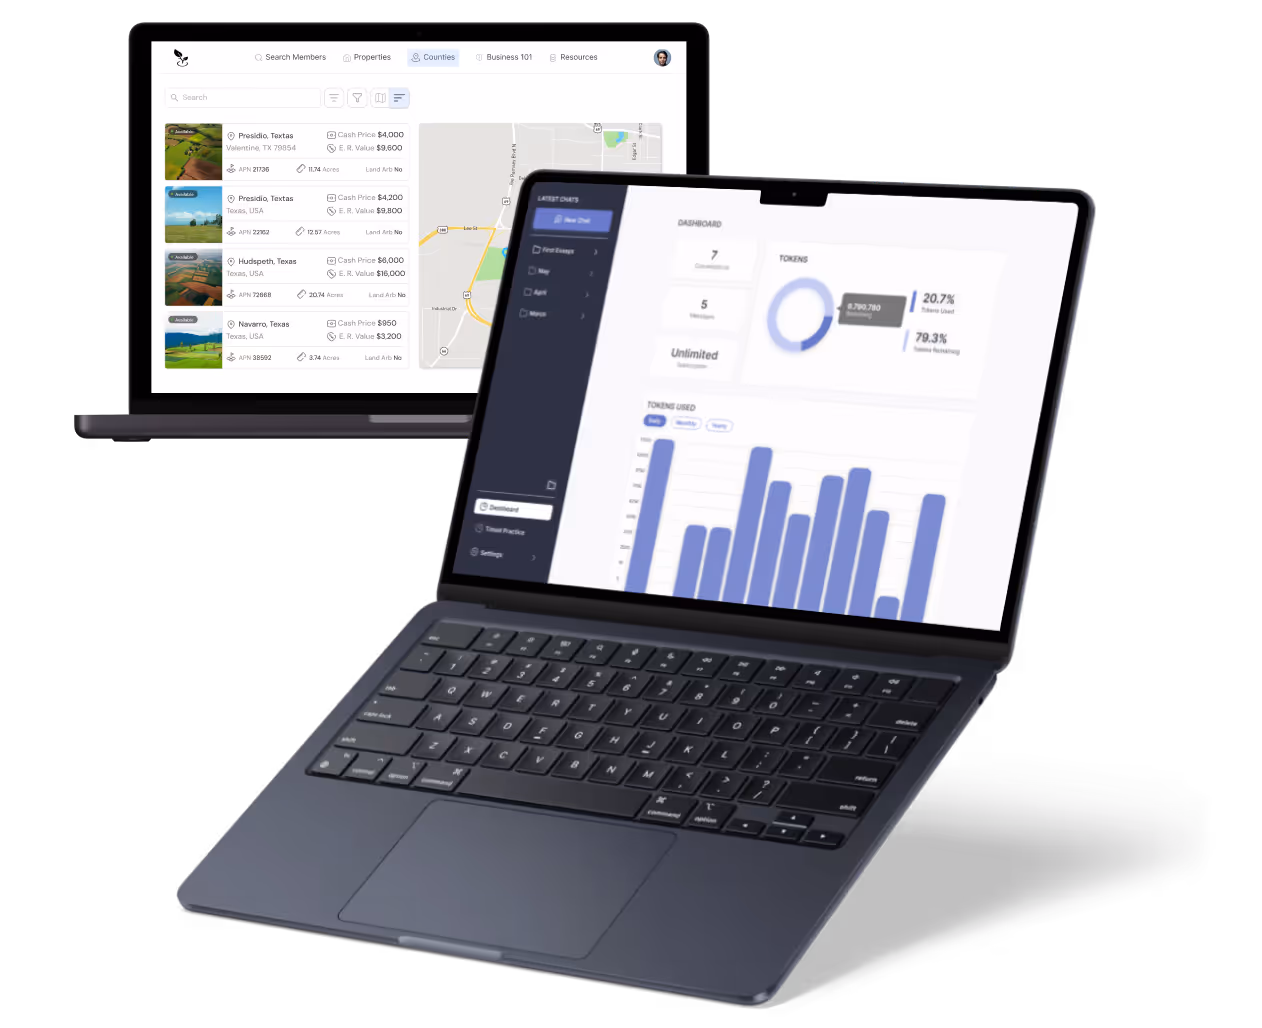
Build a sales dashboard with Bubble. Real-time pipeline visibility, rep performance, and revenue forecasting — a custom view without BI tool costs.


Sales managers making decisions from weekly spreadsheet exports are always looking at yesterday's pipeline. A sales dashboard on Bubble gives your team live pipeline visibility, rep performance tracking, and activity reporting.
Spreadsheets cannot enforce data entry, trigger alerts, or surface trends automatically. A Bubble sales dashboard centralizes your revenue data and makes it fully actionable for every manager and rep.
Key Takeaways
- Live pipeline view: Bubble displays deal counts and values per stage from your data model without weekly spreadsheet exports.
- Rep performance tracking: Quota attainment percentages and revenue closed per rep update automatically as deals progress through stages.
- Activity logging: Reps log calls, emails, and meetings in the dashboard, connecting activity data to deal outcomes over time.
- Forecast calculation: Weighted pipeline forecasts multiply deal value by stage probability and sum results automatically in Bubble.
- Manager summaries: Admin views aggregate team activity and pipeline data in one screen without manual report compilation each week.
- Integration ready: Bubble connects to CRMs via API so your dashboard can pull from existing systems where needed.

What Data Architecture Does a Bubble Sales Dashboard App Need?
A Bubble sales dashboard needs Deal, Activity, Rep, Target, ForecastRecord, and MetricSnapshot data types. Relationships between these types drive every pipeline, performance, and forecast calculation in the app.
Well-defined data types with consistent field naming make building calculated fields, filtered views, and scheduled snapshots significantly faster during development.
- Deal data type: Stores deal name, value, stage, assigned rep, close date, probability percentage, and account name per deal.
- Activity data type: Captures activity type, logged date, associated deal, assigned rep, notes, and a completed boolean field.
- Rep data type: Holds rep name, team assignment, manager reference, active status, and current quota period for each rep.
- Target data type: Stores quota amount, period start and end dates, assigned rep, and target type such as revenue.
- ForecastRecord data type: Captures weighted pipeline total, period, snapshot date, rep or team scope, and the calculation method used.
- MetricSnapshot data type: Stores a point-in-time metric value, metric name, associated rep or team, and timestamp for trend tracking.
See Bubble app examples to understand how sales and reporting data architectures are structured in production Bubble dashboard builds.
How Do You Build Real-Time Sales Pipeline Visibility in Bubble?
Pipeline visibility uses repeating groups grouped by stage, with calculated text elements summing deal values and counts for each stage column using Bubble's search and filter expressions.
A clear pipeline view is the first thing sales managers look for. Bubble builds this with filtered repeating groups and aggregate calculations without any custom code.
- Pipeline stage summary: Each stage column runs a filtered search to count and sum deal values for that stage.
- Deal count per stage: A text element shows a deal count filtered to each stage for quick volume scanning.
- Weighted forecast: Each deal's value multiplies by its probability; a sum across open deals produces the weighted pipeline total.
- Close date view: A date filter lets managers see deals closing this month, this quarter, or a custom range.
- Stage movement: When a rep updates a deal's stage, the pipeline columns recalculate immediately without any page reload required.
Real-time pipeline visibility reduces the lag between rep activity and management awareness, enabling faster coaching and deal intervention decisions.
How Do You Build Rep Performance and Quota Tracking in Bubble?
Rep performance tracking uses filtered Deal and Activity searches scoped to each rep, compared against their Target record to calculate quota attainment as a displayed percentage.
Quota attainment visibility motivates reps and gives managers the data they need to intervene before a period closes with missed targets.
- Per-rep deal count: A Deal search scoped to the rep and current period counts closed and open deals separately.
- Revenue closed: Deals filtered by rep, closed stage, and period range are summed to show revenue closed versus quota.
- Quota attainment percentage: Revenue closed divides by the Target amount; the result displays as a percentage with progress bar.
- Leaderboard display: A repeating group sorted by attainment percentage produces a ranked leaderboard visible to the whole sales team.
- Period selector: A dropdown lets managers switch between current and past periods to review historical attainment without separate reports.
Review Bubble's security model to configure privacy rules so reps see only their own data while managers see the full team view.
How Do You Build Sales Activity Reporting in Bubble?
Activity reporting uses the Activity data type filtered by rep and date range, with summary calculations showing totals by activity type and correlation metrics against deal outcomes.
Activity reporting helps managers understand whether low performance reflects effort or conversion problems, which requires different coaching responses.
- Activity log entry: Reps select activity type, associated deal, and notes; the workflow creates an Activity record immediately.
- Per-rep activity totals: Filtered searches count calls, emails, and meetings per rep within a selected date range for comparison.
- Activity versus outcome: A side-by-side view shows each rep's activity count next to revenue closed or deals created.
- Manager summary view: A dashboard section aggregates team activity by type for the period, giving managers a weekly overview.
- Trend visualization: Scheduled MetricSnapshot records allow a simple chart showing activity volume trends over time for each rep.
Check Bubble pricing plans when planning scheduled workflows for metric snapshots, as higher-frequency automation requires a paid Bubble plan.
How Much Does It Cost to Build a Sales Dashboard on Bubble?
A sales dashboard MVP on Bubble typically costs $12,000 to $20,000. A full build with CRM integration, activity logging, and automated reporting ranges from $24,000 to $40,000.
CRM integration depth and the number of automated reporting workflows are the largest variables affecting total build cost for a sales dashboard.
What Are the Limitations of Building a Sales Dashboard on Bubble?
Bubble handles internal sales dashboards well. Native CRM data synchronization, real-time refresh at high data volume, and advanced chart types require additional tools or architectural decisions.
- Native CRM sync: Real-time bidirectional sync with Salesforce or HubSpot requires API workflows; no native connector handles this automatically.
- High-volume refresh: Dashboards with thousands of deals refreshing at high frequency can hit performance limits; see Bubble's scalability.
- Advanced chart types: Bubble's native chart options are limited; complex visualizations like funnel charts or heat maps need plugins.
- Complex calculations: Multi-variable forecasting models or statistical analysis beyond basic sums require external computation or API integrations.
- Data volume limits: Very large deal histories need query optimization and pagination to maintain acceptable dashboard load times.
Read Bubble's capabilities and limitations and Bubble pros and cons before deciding. Teams requiring deep CRM sync and advanced analytics should also evaluate Bubble alternatives.
Conclusion
Bubble is a strong choice for building a custom sales dashboard when your primary needs are pipeline visibility, rep performance tracking, and activity reporting in a fast internal tool.
Teams needing real-time CRM sync or advanced forecasting should account for integration complexity in their budgets. Most growing sales teams find Bubble handles the visibility and accountability features they need most.
Want to Build a Sales Dashboard on Bubble?
Sales teams that can see their pipeline clearly, track rep activity, and monitor quota attainment in one place close more revenue than teams that cannot.
At LOW/CODE Agency, we build sales dashboards on Bubble covering pipeline visibility, rep performance, activity logging, and forecasting as one complete platform.
- Data architecture: Deal, activity, rep, target, and forecast data model structured for accurate calculations and filtered views
- Pipeline visibility: Stage-grouped pipeline with deal counts, value sums, weighted forecast, and close date filtering built in
- Rep performance: Per-rep quota attainment, revenue closed, deal counts, and leaderboard updated automatically from deal data
- Activity reporting: Activity log with per-rep totals, manager summary view, and activity-to-outcome correlation reporting included
- Admin tooling: Manager dashboard for team oversight, period selection, and export of pipeline and activity summary reports
We have delivered 450+ products for clients including Coca-Cola and American Express. Bubble development services cover sales dashboard builds from architecture through launch; most engagements start around $12,000 USD.
Related Articles
Last updated on
July 3, 2026
.

Jesus is a visionary entrepreneur and tech expert. After nearly a decade working in web development, he founded LowCode Agency to help businesses optimize their operations through custom software solutions.


FAQs
Can you build a sales dashboard with Bubble?
How do you build real-time sales KPI tiles in Bubble?
How do you build a rep leaderboard in Bubble?
How do you build pipeline analytics in a Bubble sales dashboard?
How do you build activity dashboards in Bubble?
How do you build period comparison views in a Bubble sales dashboard?
Related Articles
Comparison
Bubble
Bubble vs Adalo | 11 Factors to Decide the Best One
Compare Bubble vs Adalo across 11 key factors, including app types, backend capabilities, scalability, pricing, limitations, and which platform suits your goals.
Bubble
How to Build a Restaurant Reservation App with Bubble
Launch a restaurant reservation app with Bubble no coding needed. Let guests book tables online and reduce no-shows with this no-code step-by-step guide.

Bubble
How to Build a Brewery Management App with Bubble
Build a brewery management app with Bubble no coding required. Track batches, inventory, and sales with this step-by-step no-code guide.

Bubble
How to Build an Auction Platform App with Bubble
Build an auction platform with Bubble. Run live or timed auctions, manage bids, and process payments — no custom backend needed.