Our work speaks for itself:
350+ projects. 20+ industries. 35,000+ users.
Each case shows what happens when business insight meets product expertise: measurable progress, deliberately achieved


Experience
Case studies
We’ve helped hundreds of new startups, fast-growing businesses, and Fortune 500 enterprises launch complex, production-grade no-code applications in a fraction of the time and cost of traditional development.
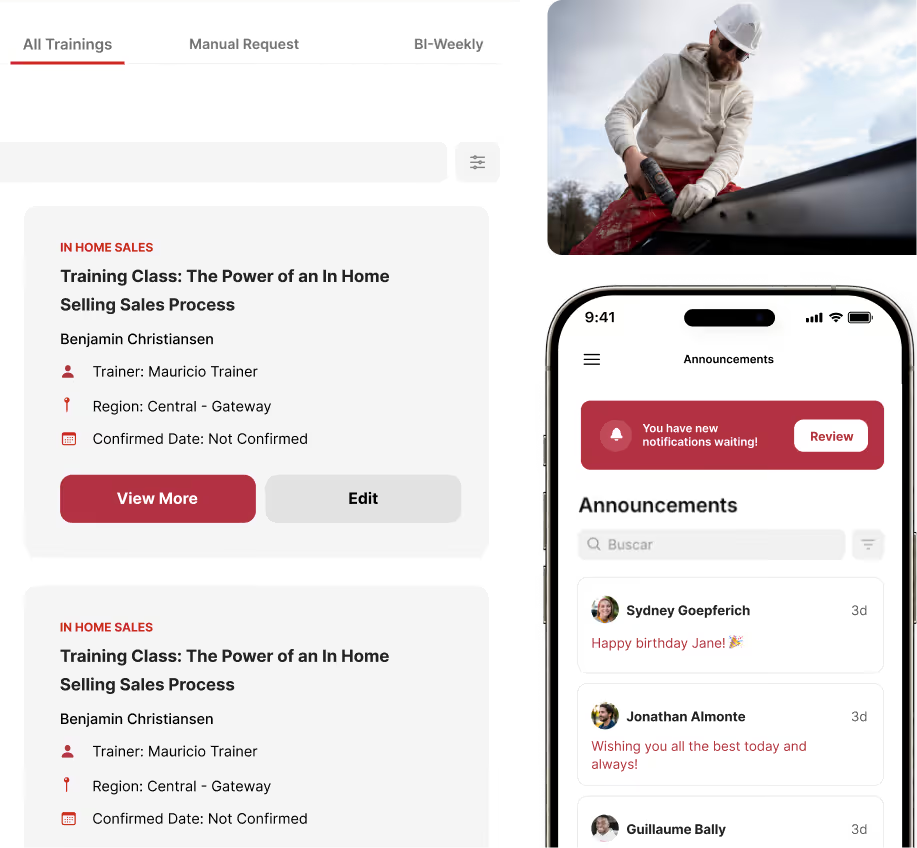
GAF
A mobile-first training management app for North America's largest roofing manufacturer. With 51 trainers handling 1,200+ annual sessions, it replaced spreadsheet workflows with smart notifications, dynamic permissions, and progress tracking — cutting admin time by 75%.
Glide
Business apps
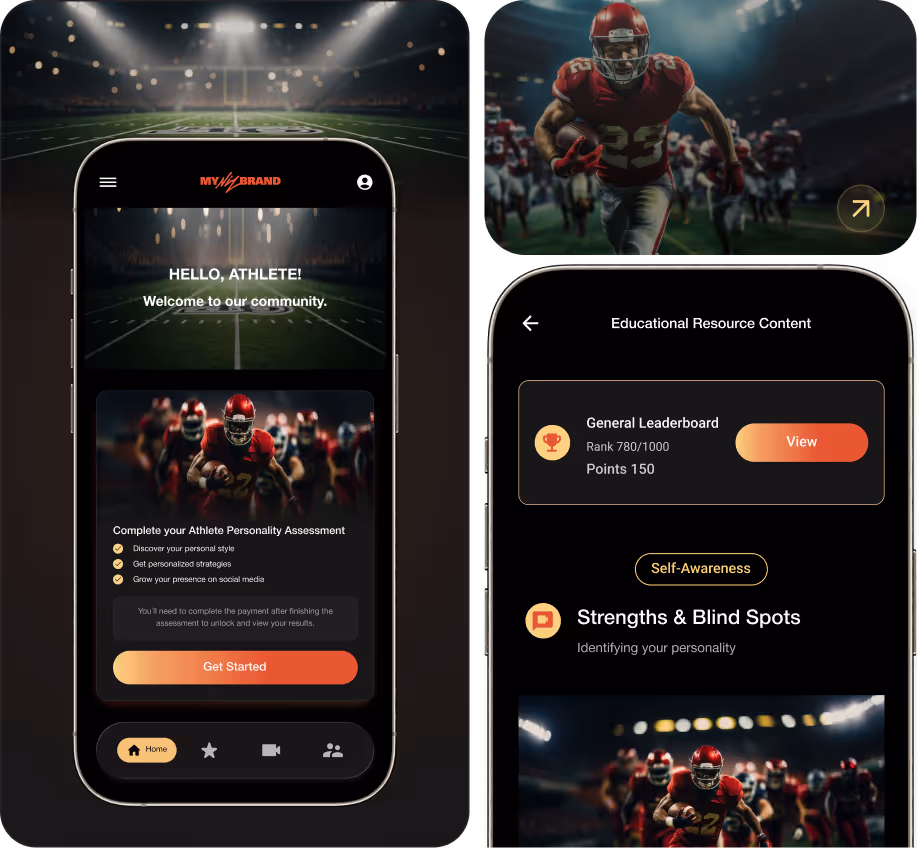
MyNil
In 12 weeks, we built an AI-powered SaaS platform that reimagines how student athletes understand and grow their personal brands. Built on FlutterFlow with n8n and Phyllo integrations, MyNIL Brand combines a personality assessment engine, contextual AI strategist, parental permission system, and a team-based leaderboard experience. Early pilot testing showed a 3× completion rate on personality assessments and a 9/10 user satisfaction score, proving the platform’s ability to deliver clarity, guidance, and momentum for athletes building their brands in the NIL era.
FlutterFlow
AI for business
Business apps
MVP Development
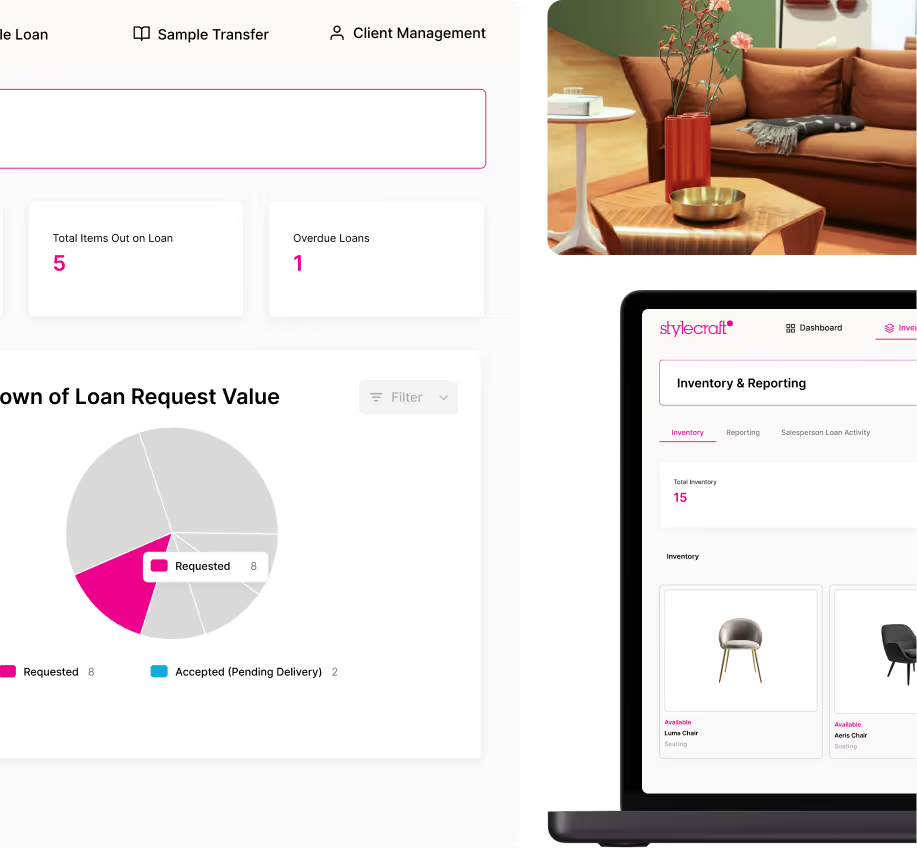
Stylecraft
In just 6 weeks, we built a real-time inventory and sample tracking system for Stylecraft, a 70-year-old furniture retailer managing thousands of samples across six showrooms in Australia. Built on Glide, the Business Automation platform centralizes every item’s location, movement history, and approval workflow, eliminating lost samples and replacing guesswork with live visibility. The system cut sample search time by 45%, increased simultaneous project management capacity by 70%, and turned Stylecraft’s $500K annual sample investment into a measurable, trackable operational asset.
Glide
Business automation
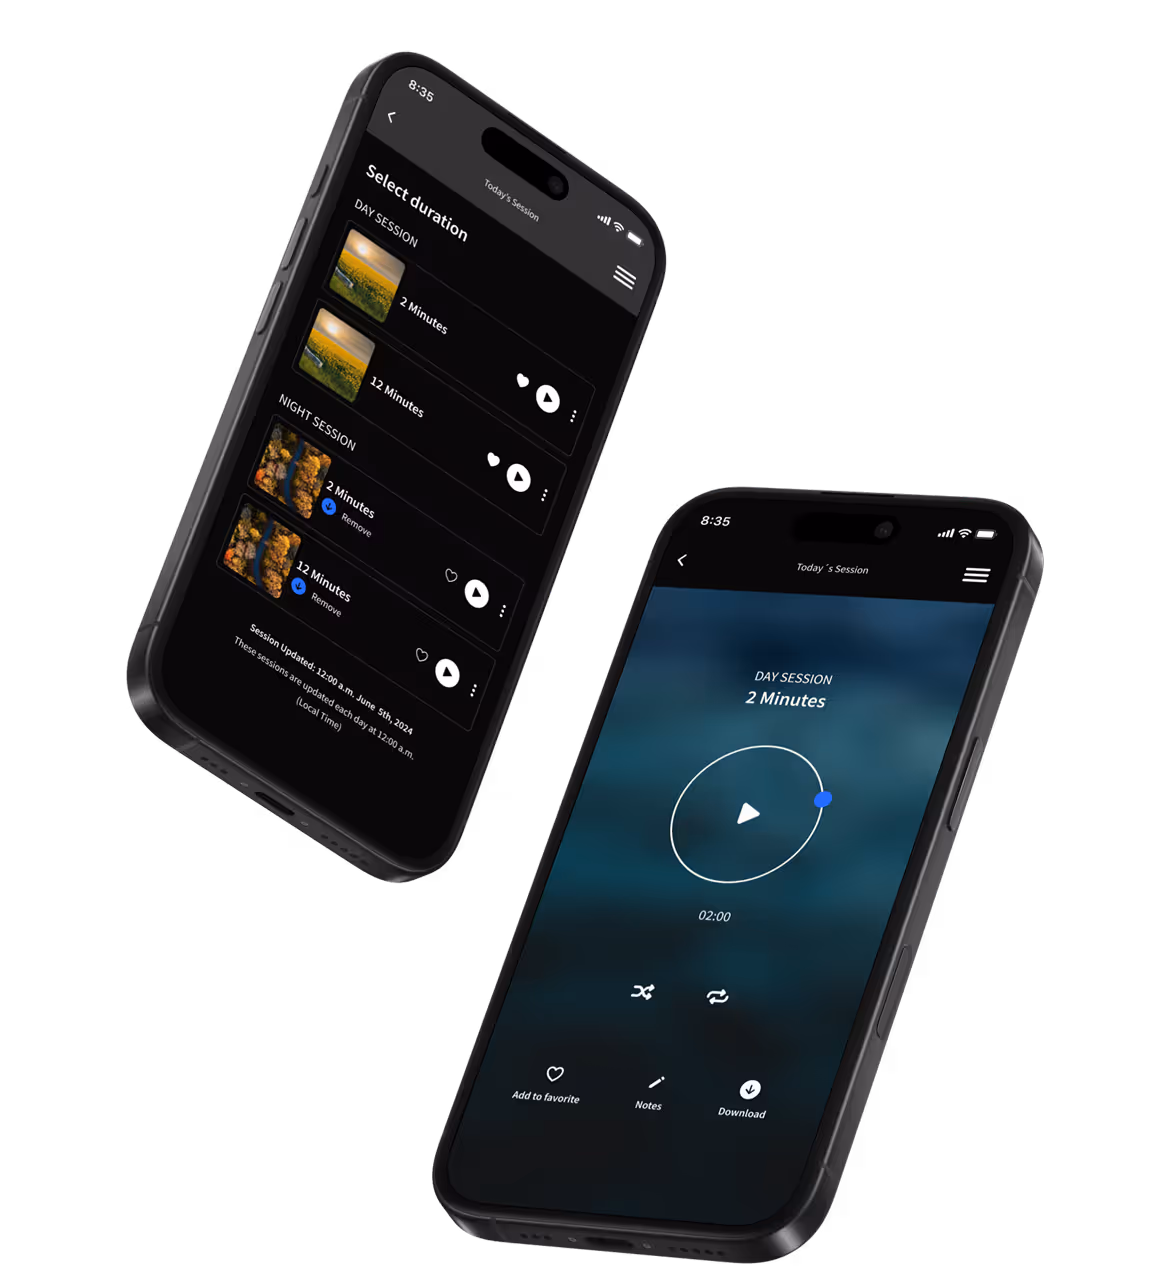
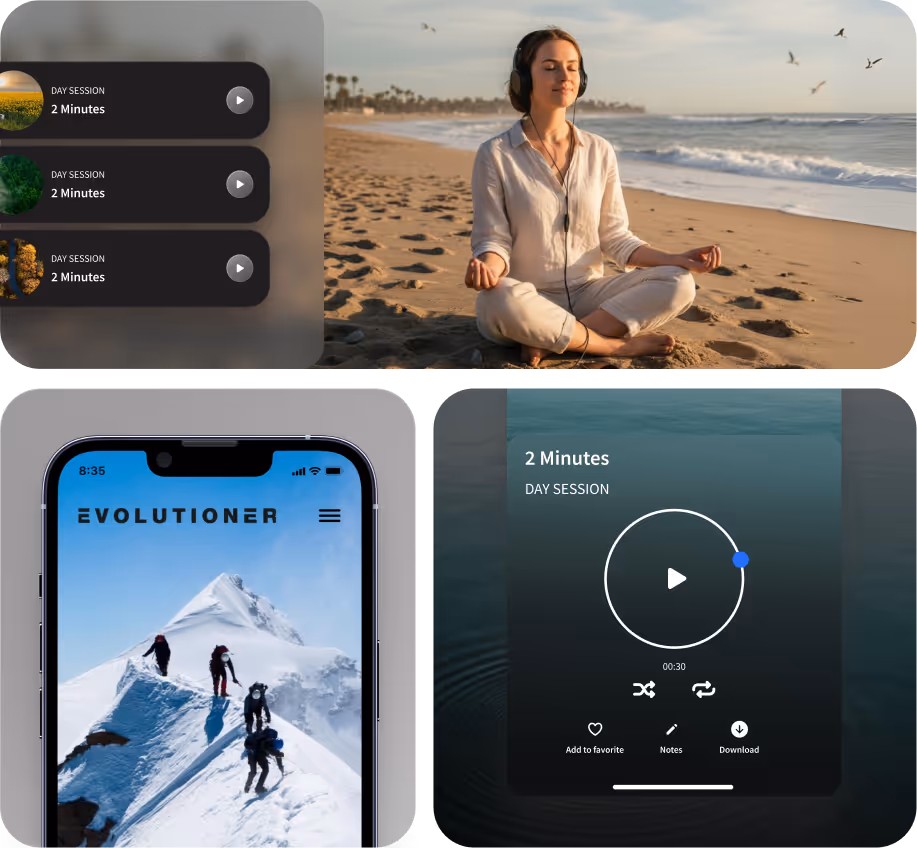
Evolutioner
In just 8 weeks, we migrated Evolutioner from BuildFire to FlutterFlow, rebuilding the wellness app without disrupting users’ daily routines. The new Business App delivers 100% reliable background audio, stable cross-platform performance, and working in-app subscriptions, cutting crashes by 85% while preserving the trusted sound therapy experience thousands depend on every day.
FlutterFlow
MVP Development
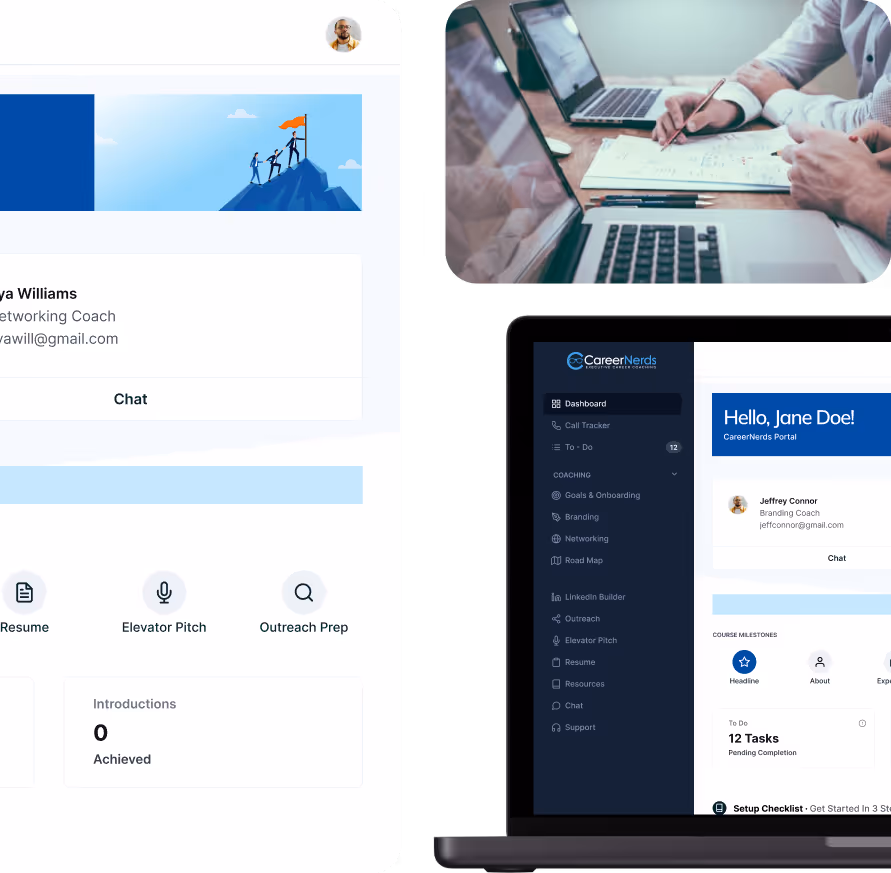
Career Nerds
In just 14 weeks, we built a custom Business App on Bubble that replaced CareerNerds’ spreadsheets with a centralized coaching platform. The app streamlines client management, automates routine tasks, and powers seamless collaboration between branding and networking coaches, resulting in a 75% cut in admin work and a 40% boost in coach productivity.
Bubble
Business apps
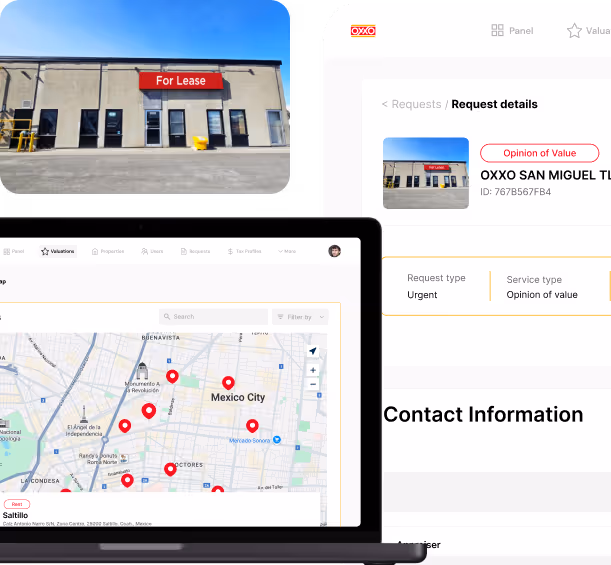
OXXO
In just 6 weeks, we built a valuation management platform for Coca-Cola FEMSA’s OXXO retail division that replaced scattered spreadsheets and emails with a single source of truth. Today, the app manages 15,000+ property valuations, reduces processing time by 40%, and provides real-time dashboards that power faster, data-driven expansion across Mexico’s most competitive retail market.
Glide
Business apps
Business automation
CHIIP
In just 8 weeks, we turned CHIIP from a lightweight MVP into a fully-fledged AI-powered funding platform. Built on Bubble, it gives community innovators the tools to turn ideas into solid, fundable proposals with built-in research, structured collaboration, and real-time AI support guiding every step.
Bubble
AI for business

The Attributes
Discover how LowCode Agency transformed The Attributes' trust assessment tool into a scalable enterprise platform on Bubble, achieving ROI within six months and supporting 3,000+ monthly users with advanced role-based access and professional-grade reporting.
Bubble
Business apps

August Point Advisors
August Point Advisors, a New York hospitality consultancy, hired us to revamp their digital presence. In three weeks, we re-launched a Webflow site that drove an 85% increase in qualified leads and boosted newsletter signups by 127% in just three months.
Webflow
Web design

Zapier Workflow Hub
A custom platform enabling users to share, explore, and learn automation workflows in a collaborative space. With over 33 educational sessions, 50 industry speakers, and 60 virtual networking events, it boosted community engagement and streamlined knowledge sharing.
Glide
Business apps

TTR Sotheby's International Realty
See how we helped TTR Sotheby's International Realty create a private listing Glide app that reduced property management time by 75% and reshaped their luxury real estate operations in just 30 days.
Glide
Business apps
Business automation

SuperQueer
See how we helped build a global LGBTQ+ community hub that connects 440 Pride organizations and their events in one app built with FlutterFlow, bringing people together worldwide!
FlutterFlow
MVP Development

BuildGenius
Using Glide, we developed a construction management app that enabled a real estate developer to save $50,000 in lost time and consolidate multiple projects under one platform. See how this solution brought order to property development.
Glide
AI for business
Business automation
MVP Development
Business apps

RedZone
Learn how we used FlutterFlow to build an app for field workers with robust offline functionalities
FlutterFlow
Business apps

RentFund
We used Glide to build a platform that offers secure rent payments for tenants and landlords. See how we helped build this MVP that achieved a 3M valuation!
Glide
MVP Development

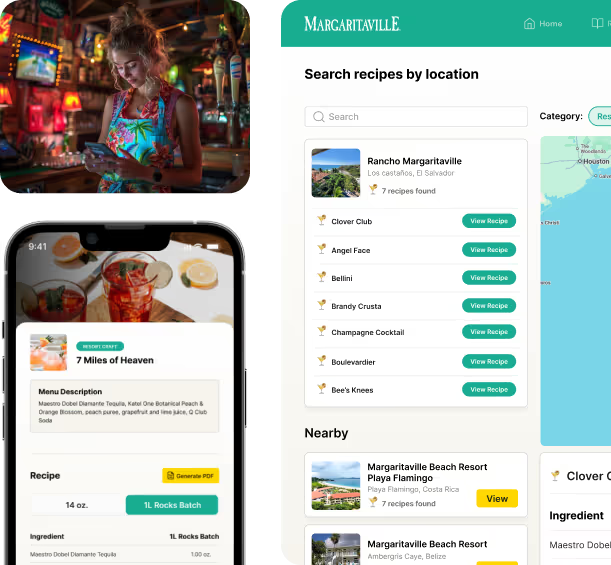
Margaritaville
No more spreadsheets! Margaritaville keeps all 100+ venues in perfect sync with a custom-built app.
Glide
Business apps
BarEssay
An AI tutor that helps students master the California Bar Exam essay. We’ve built a chat-based assistant that provides personalized studying sessions for aspiring lawyers.
Bubble
MVP Development

Language Keeper
A language learning app built specially for army professionals. With AI integration, soldiers enjoy interactive learning experiences to test and boost their skills year-round.
Glide
MVP Development

GL Hunt
From multiple spreadsheets to a dynamic, custom solution, with a unique drag and drop interface, saving 20 hours/week.
Bubble
Business apps

Known.dev
How we built a customer-centric solution that revolutionized shipment tracking in just 5 weeks and increased customer satisfaction in 30%.
Glide
Business apps
Business automation
AI for business

Juiced
Fueling creativity, amplifying engagement: Juiced's platform transforms brand-influencer collaborations which allowed the agency to grow brand partnerships in 40%.
FlutterFlow
Web design

Toycycle
Creating a safe play and happy faces for minors to trade toys was a unique challenge that we not only overcame, but the MVP has allowed Ava to grow her user base in 30% MoM.
FlutterFlow
MVP Development

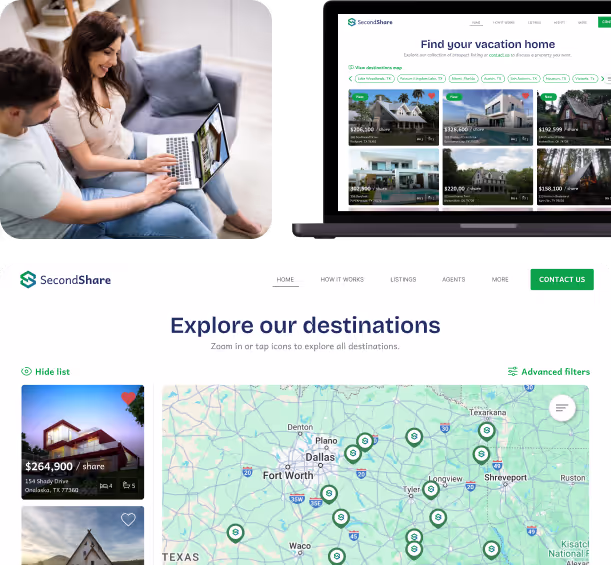
SecondShare
SecondShare's new website propelled real estate transactions an increased conversion rate in 20%.
Webflow
Web design
Unofficial Fun
A fan-centric website built in just 3 weeks for the MLB season that has been monetized since day 1.
Webflow
Web design

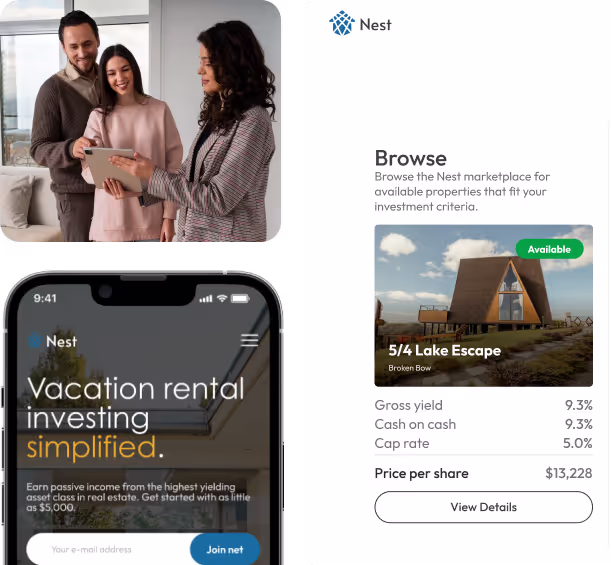
Nest Investments
From clicks to deals: A new online presence for Nest Investments that brought success and increased monthly website visits in 40%.
Webflow
Web design
MaidManage
From custom code to low-code: a native app supporting domestic workers with effortless bookings and timely payments, allowing users to reduce in 25% the time they spend on manual calculation and price estimates.
Bubble
MVP Development

TEN
Connecting technicians and event producers with a custom, upwork-like marketplace, to create extraordinary experiences, speeding up 50% the time it took event producers to fill in positions.
Bubble
MVP Development

Copious.Land
Land investing made easy: A custom community + marketplace that enhances transactions and networking for wholesale land sellers, increasing by 40% successful property transactions vs their previous community hosted on Facebook groups.
Bubble
MVP Development

StraightUp Collective
Discover how LowCode Agency transformed a complex inventory management system into a streamlined and efficient tool, reducing inventory errors by 20%.
Glide
MVP Development

Herzig
Improved Project Management for Herzig Engineering: A solution that enhanced collaboration and visibility with a customer portal that allowed them to become 30% more efficient in client communications.
Glide
Business apps
Business automation

Zapier
Salary management: Empowering employees with accurate calculations and transparency, boosting employee satisfaction by 35%.
Glide
Business apps
Business automation

introCRM
A custom CRM that boosted productivity by 60% and allowed the organization to triple their client count.
Glide
Business apps

Sheltering Arms
Impactful Change: Optimizing furniture donations with a custom inventory solution that allowed the organization to fulfill an additional 30% of donation requests.
Glide
Business automation
Business apps

12five Capital
12five Capital's journey to a 50% productivity boost - a custom client portal + AI automation tool that streamlined their client communications.
Glide
Business automation
Business apps

Simini
A white-label app service that transforms post-surgical pet care and reduced post-surgical concerns in 40%.
Glide
Business automation
Business apps


Cracking the code
By the numbers


Let's talk. No commitment, just a quick chat.
MVP Development
"Sound and vibration is the building blocks of the universe", Albert explained to us. "If used correctly, it can improve not only your brain but your overall health and well-being." But none of that mattered if users couldn't reliably access the sessions they needed.
85%
reduction in app crashes after FlutterFlow migration
100%
background audio reliability achieved
,
Evolutioner