How to Build a Spending Analytics Dashboard with FlutterFlow
15 min
read
Learn how to create a spending analytics dashboard using FlutterFlow with step-by-step guidance and best practices.


A FlutterFlow spending analytics dashboard can connect to real bank data through Plaid, categorise transactions automatically, and show users their spending patterns in a mobile-first interface. The question is whether the platform handles the data complexity and compliance requirements at production scale.
The answer depends on where you draw the boundary between FlutterFlow and your backend. This article covers what the platform builds well, what it cannot do, and what the build costs.
Key Takeaways
- Transaction categorisation is the product's core value: Whether automated via API or ML-enhanced, getting categories right is what makes the dashboard worth using.
- Plaid does the heavy lifting on data: FlutterFlow displays what the open banking API returns, transformation and enrichment logic lives in a backend service, not the app layer.
- Charts and visualisations are a FlutterFlow strength: Pie charts, bar graphs, trend lines, and comparative period views are all achievable within the platform's native widgets.
- Consumer and SMB versions have different compliance needs: Consumer apps trigger open banking regulations; SMB expense analytics may intersect with accounting software integrations.
- Build costs range from $15,000 to $55,000: Scope depends on the number of data sources and the sophistication of the categorisation engine.

What Can FlutterFlow Build for a Spending Analytics Dashboard?
FlutterFlow builds the data display, chart, and notification layers of a spending analytics dashboard effectively. It reads categorised transaction data from your backend, renders charts and summaries, and triggers alerts based on rule engine outputs. The categorisation engine, data normalisation, and Plaid integration live outside the FlutterFlow layer.
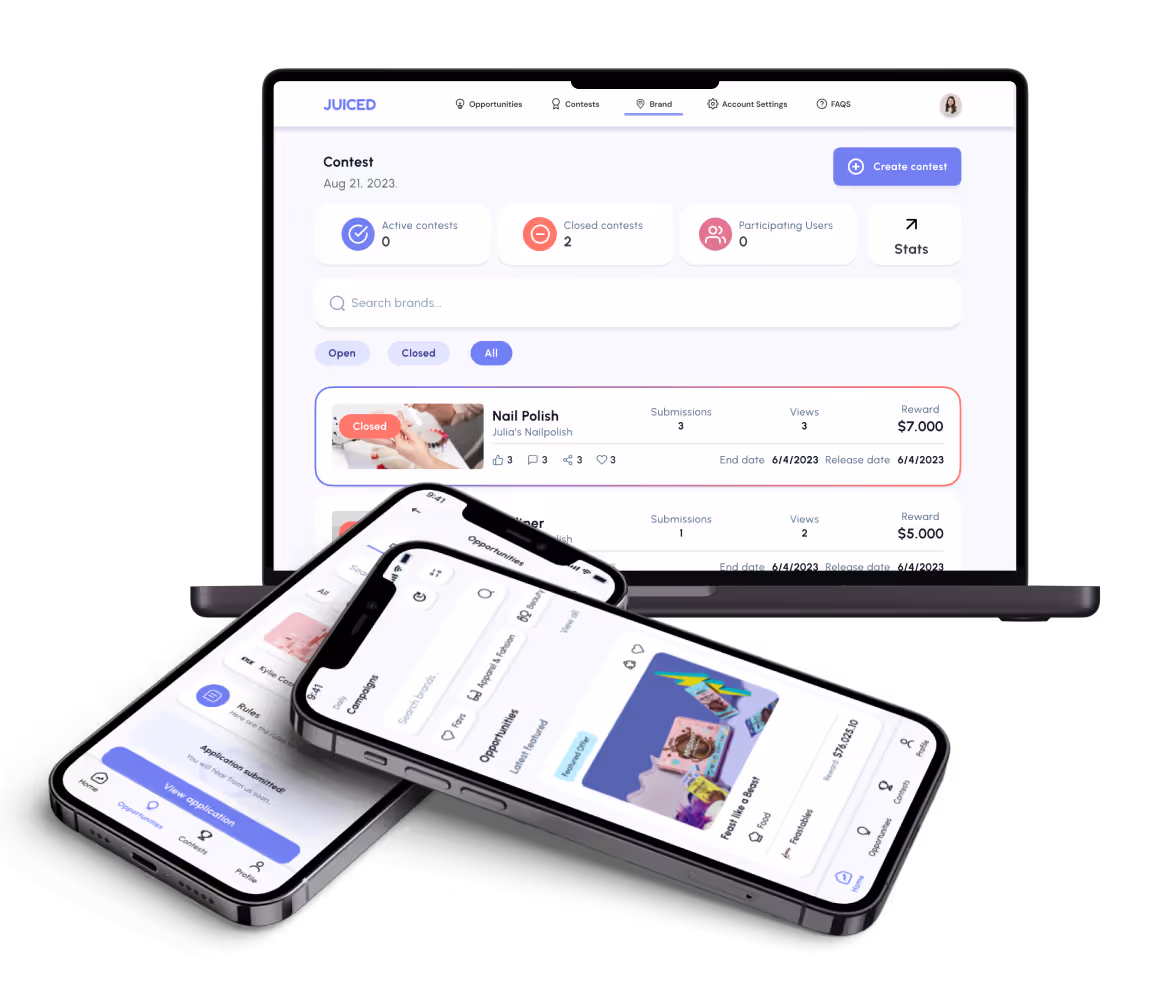
For a sense of the visual complexity achievable in production, review FlutterFlow dashboard app examples to see how chart-heavy data UIs perform in the platform.
Transaction Feed with Categorisation
A Plaid-connected transaction list displays merchant name, amount, date, and automatically assigned category with colour-coded icons. Categories come from your backend enrichment layer, not from FlutterFlow directly.
Transaction data flows from Plaid to your backend service, is normalised and categorised, then surfaces in Firestore where FlutterFlow reads and displays it.
- Transaction list display: Each transaction shows merchant name, amount, date, and category icon in a scrollable feed sorted by date.
- Category colour coding: Each spending category has a distinct colour and icon applied consistently across the feed, charts, and drill-down views.
- Category correction flow: Users can override an incorrectly categorised transaction, with the correction writing back to Firestore for backend model improvement.
Transaction categorisation accuracy is what users judge the product on, a miscategorised feed frustrates users faster than any UI issue.
Monthly Spending Breakdown Chart
A pie or donut chart shows the percentage of total monthly spend by category. Tapping a segment expands into the individual transactions making up that category for that period.
Chart data is aggregated in your backend by month and category, then written to Firestore as a summary document that FlutterFlow reads on dashboard load.
- Category percentage display: Donut chart shows spending proportion per category for the current or selected month with percentage labels.
- Tap-to-drill-down interaction: Tapping a chart segment navigates to a filtered transaction list showing only that category's transactions for the period.
- Period selector: Users switch between current month, last month, or custom date ranges to update both the chart and transaction list simultaneously.
Period-over-Period Comparison View
Side-by-side or overlaid bar charts compare spending in any category across two selected months, quarters, or custom date ranges. Users identify whether their spending in a given category is increasing or decreasing over time.
Comparison data is calculated in the backend and returned as a pre-aggregated dataset, FlutterFlow renders the chart from the values rather than performing the calculation.
- Month-over-month comparison: Bar charts display the same category's spend for two selected months side by side for quick trend identification.
- Category filter for comparison: Users select which category to compare, or view total spend across all categories in the selected periods.
- Custom date range selection: Users define any start and end date for each period in the comparison, not just calendar months.
Merchant-Level Spending Analysis
A ranked list of top merchants by total spend in the selected period shows visit frequency and average transaction size. This surfaces habitual spending patterns users are often unaware of.
Merchant aggregation runs in the backend service and writes ranked summaries to Firestore for display, FlutterFlow renders the ranked list from these pre-calculated values.
- Top merchant ranking: Merchants ranked by total spend in the selected period with total amount, transaction count, and average transaction size displayed.
- Visit frequency display: Number of transactions per merchant in the period shown alongside total spend, revealing high-frequency low-value habits clearly.
- Average transaction size: Mean transaction value per merchant helps users identify where individual purchases are higher than expected.
Budget vs Actual Overlay
For users who set category budgets, a combined chart overlays budgeted amounts with actual spend. Over-budget categories highlight in a distinct colour with the overspend amount displayed prominently.
Budget data stores in Firestore per user and per month, users can set budgets in the app and update them at any time.
- Budget entry flow: Users set monthly budgets per spending category directly in the app, stored against their profile for comparison each period.
- Actual vs budget overlay: Budget line displays alongside actual spend in the same chart, making over and under-budget categories immediately visible.
- Overspend alert display: Categories exceeding budget highlight in red with the overspend amount and percentage displayed on the chart card.
Spending Trend Line
A 30-day or 90-day moving average trend line for total daily spending lets users see whether their overall spending is trending up or down over time.
Trend line data requires daily spending aggregations calculated in the backend, FlutterFlow renders the line chart from the aggregated values stored in Firestore.
- Daily spending aggregation: Total daily spend from all categories summed and stored as daily data points for trend line calculation.
- Moving average display: 30-day or 90-day moving average overlaid on the daily spend line, smoothing noise and showing the underlying direction clearly.
- Trend direction indicator: Visual indicator showing whether the trend line is increasing, decreasing, or flat over the selected period.
Unusual Spending Alerts
Push notifications trigger when a single transaction exceeds a threshold or when a category total reaches a defined percentage above the user's monthly average. Alert rules evaluate in a backend rule engine, not in FlutterFlow.
Firebase Cloud Messaging delivers push notifications when the backend rule engine flags a condition, FlutterFlow handles the notification display and in-app alert centre.
- Large transaction alert: Push notification when a single transaction exceeds the user's configured threshold, prompting review for potential fraud or unplanned spend.
- Category overspend alert: Notification when a category's month-to-date total reaches a defined percentage above the user's historical average for that category.
- In-app alert centre: All triggered alerts display in an in-app notification centre with the transaction or category detail that triggered each alert.
How Long Does It Take to Build a Spending Analytics Dashboard with FlutterFlow?
A simple spending dashboard MVP with manual transaction entry and basic category charts takes 4 to 8 weeks. A full analytics dashboard with Plaid integration, automated categorisation, comparative views, and alerts takes 12 to 20 weeks.
Timeline depends heavily on Plaid API onboarding approval timelines and the complexity of the backend categorisation engine required.
- Simple MVP timeline: Manual transaction entry, basic category pie chart, and monthly summary ship in 4 to 8 weeks with a focused scope and no Plaid integration.
- Full dashboard timeline: Plaid bank connection, automated categorisation, comparative period views, alerts, and merchant analysis extend the build to 12 to 20 weeks total.
- Plaid onboarding factor: Plaid production API access requires an approval process that can add 2 to 4 weeks before the first real bank transaction appears in the app.
- Backend categorisation engine: Building or integrating an ML-enhanced categorisation service adds 3 to 5 weeks of backend development independent of the FlutterFlow layer.
- Phased approach advantage: Launching manual entry with basic charts first lets you validate the UX while the Plaid integration and categorisation engine build in parallel.
FlutterFlow builds the data display and chart layers 2 to 3 times faster than a custom build. Plaid integration and backend categorisation take similar time regardless of which front-end platform you use.
What Does It Cost to Build a FlutterFlow Spending Analytics Dashboard?
A FlutterFlow spending analytics dashboard costs $15,000 to $70,000. A manual-entry MVP with basic charts sits at the lower end. A full Plaid-connected dashboard with backend categorisation, alerts, and comparative views sits at the top.
Reference the FlutterFlow pricing plans guide for platform cost baseline, then stack Plaid API fees and backend infrastructure costs on top to reach a realistic project total.
| Cost Component | Range | Notes |
|---|---|---|
| FlutterFlow platform | $0–$70/month | Standard or Teams plan |
| Freelance developer | $50–$150/hour | Project: $15,000–$50,000 |
| Agency build | $25,000–$70,000 | Full Plaid-connected dashboard |
| Plaid API fees | Variable | Per-connection and transaction enrichment pricing |
| Firebase/Firestore hosting | $50–$300/month | Scales with user count and query volume |
| Backend categorisation service | $100–$500/month | Infrastructure for data transformation layer |
- Platform cost is minimal: FlutterFlow's subscription fee is a small fraction of total project cost; Plaid API fees and backend infrastructure drive ongoing costs at scale.
- Freelancer vs agency tradeoff: Freelancers suit manual-entry analytics tools; agencies are preferred for Plaid-connected dashboards with backend data pipelines and security architecture.
- vs Custom development: A custom spending analytics platform costs $100,000 to $300,000 or more; FlutterFlow delivers equivalent display functionality at $15,000 to $70,000.
- Hidden cost: Plaid production tier: Plaid's production tier costs more than the development tier, budget for production API pricing before launch, not after user acquisition begins.
- Hidden cost: financial data breach insurance: Apps holding bank-connected transaction data require appropriate cyber liability insurance, an often-overlooked line item in fintech budgets.
- Hidden cost: app store finance category review: Finance category app store submissions face longer review times and stricter compliance documentation requirements than other categories.
Budget a contingency of 20 percent for Plaid API integration edge cases and app store compliance requirements that emerge during the final testing phase.
How Does FlutterFlow Compare to Custom Development for a Spending Analytics Dashboard?
FlutterFlow is 60 to 70 percent cheaper than a custom-built spending analytics platform for a feature-equivalent dashboard, and delivers the visualisation and display layer in 4 to 8 weeks versus 4 to 8 months for a full custom build.
| Dimension | FlutterFlow | Custom Build | Off-the-Shelf Tools |
|---|---|---|---|
| Build timeline | 4–20 weeks | 4–8 months | Days to configure |
| Cost range | $15,000–$70,000 | $100,000–$300,000+ | No white-label option |
| Custom branding | Full control | Full control | None |
| Data ownership | Full ownership | Full ownership | Vendor-controlled |
| ML categorisation at scale | External service required | Fully engineerable | Platform-provided |
| Real-time fraud detection | Not suitable | Engineerable | Limited |
- Visualisation speed is the clear advantage: FlutterFlow's native chart widgets deliver a polished analytics UI in weeks; equivalent custom chart components take months to build and test.
- Cost advantage is significant: Custom spending analytics platforms start at $100,000; FlutterFlow delivers equivalent consumer dashboard functionality at $15,000 to $70,000.
- When FlutterFlow wins: Consumer spending trackers, SMB expense overviews, and fintech MVP analytics dashboards benefit from FlutterFlow's speed and cost advantage.
- When custom wins: Enterprise-grade financial analytics platforms, proprietary transaction intelligence products, and real-time fraud detection dashboards require dedicated backend services.
A Bubble versus FlutterFlow for dashboards comparison clarifies that FlutterFlow's native mobile performance gives spending analytics a speed advantage over web-first alternatives.
What Are the Limitations of FlutterFlow for a Spending Analytics Dashboard?
FlutterFlow cannot run a transaction categorisation model natively. It also cannot normalise data across multiple banks or execute complex financial analytics. These functions belong in your backend service layer, not the app layer.
Before building any bank-connected dashboard, understand FlutterFlow security for financial data, Plaid access tokens and transaction records require encryption and strict Firestore access controls from day one.
- Categorisation accuracy depends on external services: FlutterFlow displays category labels, the accuracy of those labels depends entirely on the quality of Plaid enrichment data or your separate ML service.
- Data transformation complexity: Normalising transactions from multiple banks with different date formats, merchant name variations, and currency handling requires a dedicated processing layer before data reaches FlutterFlow.
- Chart library constraints: FlutterFlow's built-in chart options cover common types but limit customisation of axis formatting, interactive tooltips, and multi-series overlays common in analytics dashboards.
- Real-time update costs: Refreshing Plaid transaction data on every app open generates API call costs that compound rapidly at scale, caching strategy must be designed deliberately.
- Scale considerations: A multi-bank dashboard for thousands of concurrent users generates significant Firebase and Plaid API load requiring infrastructure planning beyond default configuration.
- Vendor dependency: Plaid pricing changes or API deprecations directly affect the core data layer of the entire application, monitor Plaid's developer changelog as a routine practice.
Knowing these limits before scoping prevents the most expensive mistake in fintech app builds: discovering the data pipeline requirements after the FlutterFlow UI is already designed.
How Do You Get a FlutterFlow Spending Analytics Dashboard Built?
You need a developer or agency with specific Plaid API integration experience, backend data transformation expertise, and financial chart component knowledge in FlutterFlow. General FlutterFlow experience is not sufficient for a bank-connected analytics product.
The top FlutterFlow agencies list for fintech work filters to teams who have shipped Plaid-connected applications before, that specific experience cuts weeks off the integration phase.
- Required expertise: Plaid API integration, backend data transformation service development, Firebase performance optimisation, and financial chart widget expertise are baseline requirements for this build.
- Freelancer vs agency tradeoff: Agencies are preferred for Plaid-connected dashboards with backend data pipelines; freelancers are viable only for manual-entry analytics tools without bank connections.
- Red flag: data transformation inside FlutterFlow: Any developer planning to run transaction normalisation or categorisation inside FlutterFlow actions does not understand the platform's data processing limits.
- Red flag: no Plaid production experience: Developers unfamiliar with Plaid's production tier approval process, enrichment API features, and rate limits will cause delays and integration errors.
- Key question to ask: "How do you handle Plaid transaction normalisation across multiple bank formats?" and "What chart library do you use for complex financial visualisations in FlutterFlow?"
- Expected project timeline: Plaid onboarding takes 2 to 4 weeks; backend data service takes 3 to 5 weeks; FlutterFlow dashboard build takes 6 to 10 weeks; testing and app store submission adds 2 to 4 weeks.
Interview at least two agencies and ask for verifiable examples of Plaid-connected applications they have shipped to production before committing to a project.
Conclusion
FlutterFlow is a strong delivery vehicle for the spending analytics dashboard's display layer. Charts, transaction feeds, period comparisons, and alert notifications all work well within the platform.
The categorisation engine, data normalisation, and compliance architecture live outside FlutterFlow. Define your data sources and categorisation approach before starting the build, the backend data pipeline determines the dashboard's value, not the chart colours.
Building a Spending Analytics Dashboard with FlutterFlow? Here Is How LowCode Agency Approaches It.
Most fintech dashboards fail at the data pipeline, not the UI. Getting Plaid integration, transaction normalisation, and security architecture right from day one is what separates a product users trust from one they delete after a week of inaccurate categories.
At LowCode Agency, we are a strategic product team, not a dev shop. We build FlutterFlow spending analytics dashboards with the full backend behind them: Plaid API integration, transaction normalisation services, categorisation accuracy, Firebase security configuration, and financial chart components from a team that understands how financial data needs to behave at production scale.
- Plaid API integration: We manage the full Plaid onboarding, production approval, and transaction enrichment setup so bank data flows reliably into your dashboard from day one.
- Backend data transformation: We build the normalisation service that converts multi-bank transaction formats into a consistent data schema before anything reaches the FlutterFlow layer.
- Categorisation engine: We integrate and tune the categorisation service that labels transactions accurately, the accuracy of this layer is what users actually judge the product on.
- Financial chart build: We configure FlutterFlow's chart widgets for spending breakdowns, period comparisons, budget overlays, and trend lines with the interaction depth analytics users expect.
- Security architecture: We apply Firestore security rules, Plaid token encryption, and access controls so bank-connected data is protected at every layer of the stack.
- Alert system design: We build the backend rule engine that evaluates unusual spending conditions and triggers Firebase Cloud Messaging notifications reliably at scale.
- Full product team: Strategy, UX, development, and QA from a single team so your spending dashboard is production-ready, not just visually impressive.
We have built 350+ products for clients including Coca-Cola, American Express, and Sotheby's. We know how to scope and deliver FlutterFlow financial applications that meet the data quality and security standards fintech products require.
If you are ready to build, let's scope your spending analytics dashboard.
Related Articles
- How to Build a Staffing Marketplace Platform with FlutterFlow
- How to Build a Sports Event Registration App with FlutterFlow
- How to Build Sports Apps with FlutterFlow
- How to Build a Spa Appointment App with FlutterFlow
- How to Build an SOP Documentation App with FlutterFlow
- How to Build Onboarding and SOP Apps with FlutterFlow
Last updated on
June 25, 2026
.

Jesus is a visionary entrepreneur and tech expert. After nearly a decade working in web development, he founded LowCode Agency to help businesses optimize their operations through custom software solutions.


FAQs
What are the first steps to create a spending dashboard in FlutterFlow?
How can I visualize spending data effectively in FlutterFlow?
Can I integrate real-time data updates in a FlutterFlow dashboard?
What are common challenges when building analytics dashboards with FlutterFlow?
How do I secure sensitive spending data in my FlutterFlow app?
Is FlutterFlow suitable for building dashboards compared to custom coding?
Related Articles
FlutterFlow
Comparison
FlutterFlow vs Noodl | 10 Factors to Decide the Best One
Compare FlutterFlow vs Noodl across 10 key factors like performance, pricing, customization & more to find the best no/low-code platform for your app

FlutterFlow
How to Build a Downtime Tracking App with FlutterFlow
Learn how to create a downtime tracking app using FlutterFlow with step-by-step guidance and best practices for efficient app development.

FlutterFlow
How to Build a Subscription Ecommerce App with FlutterFlow
Learn how to create a subscription ecommerce app using FlutterFlow with step-by-step guidance and best practices.

FlutterFlow
How to Build Manufacturing Apps with FlutterFlow
Learn how to create efficient manufacturing apps using FlutterFlow with step-by-step guidance and best practices.