Build an AI Productivity Insights App for Your Team
13 min
read
Learn how to create an AI-powered productivity insights app to boost your team's efficiency and track performance effectively.


Building an AI productivity insights app for your team means reading the work data your team already generates, not adding new tracking tools. Task completion rates, meeting load, cycle times, and blockers reveal far more than any time-tracking software.
This tutorial shows how to build that insights pipeline using the tools your team uses every day, without asking anyone to change how they work.
Key Takeaways
- Work data, not time tracking: Task cycle times, blocker frequency, meeting load, and rework rate are more actionable than hours logged in a time tracker.
- No new tools required: ClickUp, Asana, Monday, Jira, and Google Calendar are the data sources. No behavioural change from your team is needed.
- Four metrics matter most: Task cycle time, blocker frequency, meeting load ratio, and rework rate reveal where time is consistently lost.
- AI adds pattern recognition: A dashboard shows average cycle time; AI identifies that cycle time is 40% longer for tasks requiring approval from a specific manager.
- Ethics layer is not optional: Insights must be used to improve systems, not monitor individuals. Frame this as operational intelligence, not employee surveillance.


What Data Sources a Team Productivity Insights App Uses
The app reads from tools your team already uses. No new software, no new habits, no surveillance-style data collection required.
Understanding which data sources are available, and which to exclude, is the most important design decision before writing a single workflow.
- Project management tool: ClickUp, Asana, Monday, or Jira provides task creation and completion timestamps, blocker flags, assignee data, sprint velocity, and task category data via API.
- Calendar data: Google Calendar or Outlook provides meeting hours per team member per week, meeting-to-work ratio, and breakdown by meeting type via API.
- Communication tools: Slack API provides message volume and thread length as proxies for communication overhead. Aggregate at team level only, never individual.
- Meeting notes database: Notion or Fireflies provides action item completion rates from meetings, a leading indicator of whether commitments made in meetings are being followed through.
- What you do not need: Keystroke tracking, screen monitoring, or any active surveillance data. Work metadata is sufficient and avoids the trust and legal issues that monitoring creates.
Use Slack data carefully. Communication volume is a noisy signal at the individual level and should always be aggregated at the team level before any analysis.
The Four Productivity Metrics That Matter Most
These four metrics are the core of the insights model. Each has a specific definition and reveals a specific type of productivity problem.
Defining them precisely before building ensures the pipeline calculates what it should, not what is easiest to extract.
- Task cycle time: Average time from task creation or "started" status to completion, by task type and team. Reveals where work consistently takes longer than expected.
- Blocker frequency: Percentage of tasks marked "blocked" at any point in their lifecycle, by team and task type. A blocker rate above 20% in any workflow is a signal worth investigating.
- Meeting load ratio: Percentage of available working hours per week spent in scheduled meetings per team member. Above 40% typically correlates with longer task cycle times.
- Rework rate: Percentage of completed tasks returned, restarted, or substantially revised after initial completion. Reveals where brief clarity or quality is a recurring problem.
| Metric | Data Source | Warning Threshold | What It Reveals |
|---|---|---|---|
| Task cycle time | ClickUp, Asana, Jira | Trending up over 4 weeks | Slow workflows or capacity issues |
| Blocker frequency | ClickUp, Asana, Jira | Above 20% of tasks | Dependency or bottleneck patterns |
| Meeting load ratio | Google Calendar, Outlook | Above 40% of working hours | Meeting overload reducing output time |
| Rework rate | ClickUp, Asana, Jira | Above 15% of completed tasks | Brief quality or handoff problems |
Teams that correlate these four metrics against each other find the most actionable patterns. High meeting load combined with rising cycle time, for example, points to a capacity constraint, not a process inefficiency.
How to Build the Productivity Insights App in n8n
The pipeline has six steps. Each step is a distinct n8n sub-workflow or node group. Build them in sequence and test each before connecting to the next.
This is the technical core of the app, the part that turns raw API data into the weekly insights your team lead receives.
Step 1: Build Data Collection Sub-Workflows
One sub-workflow per data source. Each accepts a date range and returns the relevant metrics as structured JSON.
- ClickUp sub-workflow: Query tasks completed, tasks blocked, and cycle times for the period via the ClickUp API. Aggregate by team and task category.
- Google Calendar sub-workflow: Query each team member's calendar for the period via the Google Calendar API. Count total meeting minutes and categorise by meeting type.
- Meeting notes sub-workflow: Query the action item database for items created in the period. Count how many were marked complete within 7 days.
Step 2: Calculate Metrics in the Code Node
In n8n's code node, calculate the four core metrics from the raw API data. Return as a structured metrics object.
- Cycle time calculation: Group completed tasks by type and assignee team. Calculate mean and median duration. Flag types where the median is trending upward.
- Blocker rate calculation: Count tasks with any "blocked" status event divided by total tasks started in the same period. Segment by team.
- Meeting load calculation: Divide total meeting minutes by total available working minutes per team member. Return as a percentage per role.
Step 3: Run Anomaly and Pattern Detection
Pass the metrics object to GPT-4 with a context-rich prompt. Ask for three specific outputs: metrics that changed significantly versus the prior 4-week average, patterns suggesting a systemic workflow problem, and correlations between high meeting load and lower task completion.
- Structured prompt output: Ask GPT-4 to return findings as a JSON array with three fields: finding, metric evidence, and recommended investigation.
- Prior-period comparison is essential: Without the 4-week baseline, GPT-4 cannot identify what is anomalous. Pass the historical metrics alongside the current period.
- Cap findings at three per cycle: More than three findings per week creates alert fatigue. Filter to the top three by significance before delivery.
Step 4: Synthesise Insights Into Plain English
GPT-4 generates each finding in plain English. The output should read like an operations manager's weekly summary, not a data report.
- Team-level framing: Every insight refers to a team or workflow, not an individual. "The design team's cycle time for brief-to-delivery tasks increased 28% this week" is correct framing.
- One recommended action per finding: Each insight should close with a specific investigation or action, not a vague suggestion to "investigate further."
- Delivery format: A short Slack message with the top finding, or a formatted email with all three. Match the format to how your team lead prefers to receive information.
Step 5: Deliver Weekly to the Team Lead
Weekly delivery via Slack or email. Team-level insights by default. Individual-level data available on request to the team member themselves, not their manager.
- Frequency discipline: Weekly is the right cadence for most teams. Daily delivery creates noise; monthly delivery loses the operational relevance.
- Individual data access policy: Build this into the system from day one. Team members can request their own data. Managers cannot access individual data without consent.
- Archive insights to a database: Store each week's findings so the quarterly review can identify structural trends across 12 weeks.
Step 6: Add a Self-Service Query Interface
A Slack bot trigger allows the team lead to ask specific questions and receive real-time answers from the metrics database.
- Example queries: "What is the average cycle time for design tasks this month?" or "Which team has the highest blocker rate this quarter?"
- Retrieval from the metrics store: The Slack trigger calls the n8n workflow, which queries the metrics database and returns a formatted response within seconds.
- Scope queries to team-level data: The same individual data access policy applies to the query interface. Individual metrics require consent.
Connecting Productivity Insights to Meeting Data
Meeting data adds a crucial dimension to the productivity model. Meeting load, action item completion rates, and meeting type breakdown reveal patterns that task data alone cannot surface.
The right stack for AI meeting productivity tools covers the platforms that expose the cleanest meeting data APIs for this kind of integration.
- Meeting load correlation: Compare meeting hours per team member per week with task cycle times for the same period. Above 40% meeting load typically shows 20–35% longer cycle times.
- Action item completion rate: A completion rate below 70% signals either overcommitment in meetings or unclear ownership of what was agreed.
- Meeting type breakdown: Recurring meetings generating the most action items with the lowest completion rates are candidates for format changes. AI can identify these patterns across weeks of data.
- Meeting-to-deep-work ratio: For roles where deep work is the primary output, Google Calendar API can calculate uninterrupted 2-hour-plus blocks per week per team member.
Correlating meeting load with cycle time data is one of the highest-value analyses in this pipeline. The pattern either confirms a capacity constraint or rules it out quickly.
Adding Meeting Action Item Completion to the Model
Action item completion rate from meetings is a leading indicator of team execution health. It measures whether decisions made in meetings translate to completed work, which is the most common failure point in team productivity.
Using AI meeting notes and action items processed by tools like Fathom or Fireflies gives you a structured database of action items, owners, due dates, and completion status to query weekly.
- Completion rate calculation: Action items marked complete within 7 days divided by total action items created in the same period. Calculate per team and per meeting type.
- Cross-functional item tracking: Cross-team action items, where the owner is from a different team than the meeting organiser, consistently show lower completion rates than internal items.
- AI-generated improvement recommendations: When completion rates fall below 70%, the insight pipeline recommends specific changes, for example adding explicit ownership confirmation at meeting close.
- The 70% target: A completion rate below 70% week-over-week indicates a structural problem with either meeting commitments or handoff clarity.
Feed meeting action item data into the same metrics store as the task and calendar data. The combined view shows whether low completion rates correlate with high meeting load or with specific meeting types.
Surfacing Productivity Insights in Executive Reports
Team productivity insights belong in leadership briefings alongside financial and pipeline metrics. Operational health data gives leadership visibility into whether the team has the capacity to deliver on commitments.
For the executive reporting layer, AI executive report generation covers how to structure productivity data into a format that serves leadership decision-making without overwhelming them with raw metrics.
- Monthly leadership summary: Average cycle time trend, blocker frequency by team, meeting load across the organisation, and action item completion rate in a single-page format.
- Early warning alerts: If cycle time for a critical workflow increases more than 20% week-on-week, or blocker frequency in a specific team exceeds 30%, n8n sends an immediate alert to the relevant department head.
- Quarterly structural review: GPT-4 generates a 12-week trend analysis across all four metrics, identifying structural patterns such as a consistent cycle time increase since a new project began.
- Privacy framing for leadership: Present data as operational intelligence about workflows and processes, not as performance monitoring of individuals. This distinction determines whether the tool builds trust or erodes it.
The quarterly review is where the most valuable structural patterns appear. A 12-week trend shows what a single week's data cannot: whether a problem is systemic or situational.
Connecting the Insights App to Operational Workflows
The insights app becomes most useful when it connects directly to the workflows it is measuring. A finding about a specific approval bottleneck, for example, should link to the workflow responsible for that approval.
Connecting insights to AI business process automation workflows means the app can surface not just where time is lost but which automation opportunity would recover the most of it.
- Linking findings to workflows: When the app identifies a recurring blocker in a specific task type, the output includes a link to the relevant n8n workflow for review and adjustment.
- Automated investigation triggers: If cycle time for a specific task type crosses a defined threshold, the app creates a task in the operations team's project management tool to investigate.
- Closing the feedback loop: Once a workflow change is made in response to a finding, the metrics will reflect whether the change worked. Log the intervention date so the trend comparison accounts for it.
- The improvement cycle cadence: Weekly insights surface findings, monthly reviews confirm which findings produced workflow changes, and quarterly reviews measure whether those changes improved the metrics.
Conclusion
A team productivity insights app is not a surveillance tool. It is an operational intelligence system that identifies where workflows slow down, where meetings consume too much capacity, and where commitments outpace execution.
Pull your team's project management task data for the past 30 days as a CSV export. Calculate the average cycle time for your three most common task types and note which is consistently slowest. That manual analysis is the first insight your automated pipeline would surface every week.
Want to Know Where Your Team's Productivity Is Being Lost, Without Asking Your Team to Track It?
Most operations leaders know something is slowing their team down. They just cannot identify it precisely without a data system that runs automatically and surfaces patterns without manual input.
At LowCode Agency, we are a strategic product team, not a dev shop. We connect your project management, calendar, and meeting tools in n8n, build the productivity metrics pipeline, and deliver a weekly insights system that surfaces bottlenecks and patterns automatically.
- Data source audit: We confirm which APIs are available from your project management, calendar, and meeting tools before writing any workflow logic.
- Metrics pipeline build: We build the four-metric calculation layer in n8n, including the code node logic for cycle time, blocker rate, meeting load, and rework rate.
- GPT-4 analysis integration: We configure the anomaly detection and pattern recognition prompts, including the 4-week baseline comparison and the structured findings output.
- Delivery configuration: We set up weekly Slack or email delivery to the team lead, with the individual data access policy built into the system from the start.
- Meeting data integration: We connect Fathom, Fireflies, or your existing meeting notes system to the action item completion layer of the pipeline.
- Executive reporting layer: We build the monthly leadership summary and threshold alert system so leadership sees operational health data alongside pipeline and revenue metrics.
- Post-launch review at 60 days: We audit the pipeline's findings against the actual changes your team made in response, confirming the insights are actionable and the metrics are moving.
We have built 350+ products for clients including Coca-Cola, Medtronic, and Dataiku. We understand how operations teams use data and we build insights systems that drive decisions, not just dashboards.
If you are ready to stop guessing where your team's time is going, let's start with your data audit.
Last updated on
May 29, 2026
.

Jesus is a visionary entrepreneur and tech expert. After nearly a decade working in web development, he founded LowCode Agency to help businesses optimize their operations through custom software solutions.

FAQs
What are the key features of a productivity insights app?
Which AI technologies are best for analyzing team productivity?
How can I ensure data privacy in a productivity app?
What challenges might arise when building this type of app?
How does AI improve team productivity tracking compared to manual methods?
Can this app be customized for different team sizes and industries?
Related Articles

AI
AI Employee for Mortgage Brokers: Close More Loans
Qualify borrowers, follow up on applications, and answer loan queries 24/7. Your AI Employee helps mortgage brokers close more deals in less time.
AI
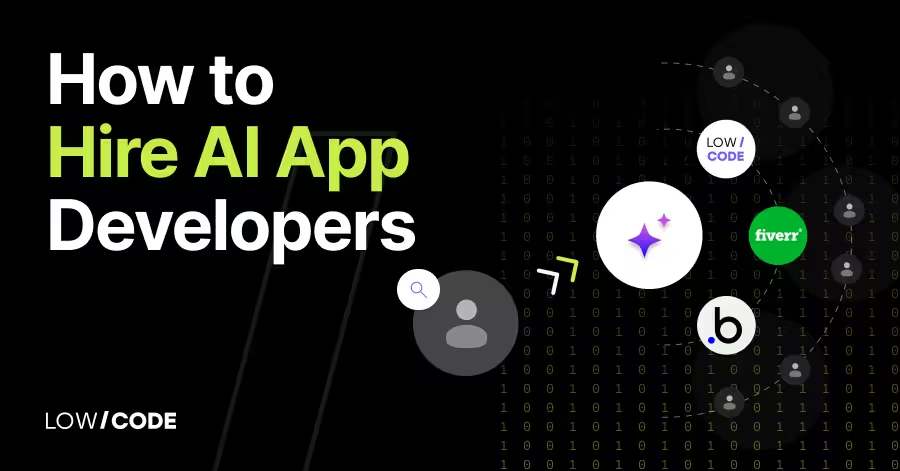
Hire AI App Developers: Cost, Skills, and Hiring Process Explained
Looking to hire AI app developers? Learn how to find the right talent, compare hiring models, estimate costs, and avoid common AI development mistakes.

AI
Top AI Tools for Healthcare Automation & Patient Care
Discover leading AI tools that enhance healthcare automation and improve patient management efficiently and securely.

AI
AI Employee for Tech Startups Moving Fast
Automate customer support, onboarding, and outreach from day one. An AI Employee gives tech startups enterprise-level efficiency without the headcount.