Burn Down Chart in Agile Product Management
Product Management
Learn how burn down charts help track progress and improve delivery in Agile product management.
Burn down charts are essential tools in Agile product management that help teams track their work progress over time. They provide a clear visual representation of remaining tasks against the project timeline, making it easier to spot delays and adjust plans. Understanding how to use burn down charts can improve your team's efficiency and ensure timely delivery.
This article explains what a burn down chart is, how it works, and why it matters in Agile product management. You will learn how to create and interpret burn down charts, common pitfalls to avoid, and best practices to maximize their benefits.
What is a burn down chart in Agile product management?
Burn down charts are graphical tools that show the amount of work left to complete in a sprint or project against the time available. They help teams visualize progress and forecast completion dates.
These charts typically plot remaining work on the vertical axis and time on the horizontal axis, updating daily to reflect current status.
- Visual progress tracking: Burn down charts provide a simple visual way to see how much work remains, helping teams stay focused and motivated throughout the sprint.
- Time versus work comparison: They compare planned work against actual progress, allowing quick identification of delays or ahead-of-schedule tasks.
- Sprint goal alignment: By showing daily progress, burn down charts help ensure the team is aligned with sprint goals and can adjust efforts if needed.
- Stakeholder communication: These charts offer a clear status update for stakeholders, improving transparency and trust in the Agile process.
Understanding what a burn down chart represents is the first step to using it effectively in Agile product management.
How do you create a burn down chart for Agile projects?
Creating a burn down chart involves tracking the total work planned and updating the remaining work daily. This process helps teams monitor their sprint or project progress accurately.
Typically, you start by estimating the total effort required and then measure how much work remains each day.
- Define total work scope: Begin by listing all tasks or user stories planned for the sprint and estimate their effort in hours or story points.
- Set timeline axis: Mark the sprint duration on the horizontal axis, usually in days, to track progress over time.
- Update daily remaining work: At the end of each day, subtract completed work from the total and plot the remaining effort on the chart.
- Use tools or templates: Employ Agile software tools or spreadsheet templates to automate chart updates and improve accuracy.
Following these steps ensures your burn down chart accurately reflects your team's progress and helps guide decision-making.
Why is a burn down chart important in Agile product management?
Burn down charts are vital because they provide real-time insights into project progress, enabling teams to respond quickly to issues and maintain momentum.
They improve transparency and support better planning and communication among team members and stakeholders.
- Early problem detection: Charts reveal if the team is falling behind schedule, allowing timely interventions to avoid missed deadlines.
- Improved team focus: Visual progress motivates team members to complete tasks efficiently and meet sprint goals.
- Enhanced planning accuracy: Historical burn down data helps refine future sprint estimations and workload distribution.
- Stakeholder confidence: Regular updates via burn down charts build trust by showing clear progress and realistic delivery expectations.
Overall, burn down charts are key to maintaining Agile principles of transparency, inspection, and adaptation.
What are common mistakes to avoid when using burn down charts?
While burn down charts are powerful, misuse or misunderstanding can reduce their effectiveness. Avoiding common mistakes ensures you get the most value from this tool.
Many teams struggle with inaccurate data or misinterpretation, which can lead to poor decisions.
- Inaccurate effort estimates: Over- or underestimating task effort skews the chart and misleads progress tracking.
- Irregular updates: Failing to update the chart daily results in outdated information and reduces its usefulness.
- Ignoring scope changes: Not reflecting added or removed tasks distorts the remaining work and progress view.
- Overemphasis on the chart: Relying solely on the burn down chart without team communication can overlook underlying issues affecting progress.
Being aware of these pitfalls helps maintain the reliability and usefulness of burn down charts in Agile projects.
How can burn down charts improve team collaboration and productivity?
Burn down charts foster collaboration by making progress visible and encouraging shared responsibility for sprint goals. They also help identify bottlenecks early.
Teams can use the chart as a daily reference to discuss challenges and adjust workloads.
- Shared progress visibility: Everyone sees the same data, promoting transparency and collective ownership of tasks.
- Facilitates daily stand-ups: Teams use the chart to focus discussions on areas needing attention or support.
- Encourages accountability: Visible progress motivates members to complete their work on time.
- Supports continuous improvement: Teams analyze burn down trends to refine processes and increase efficiency.
By integrating burn down charts into daily workflows, teams enhance communication and boost productivity.
What tools support creating and managing burn down charts?
Several tools simplify burn down chart creation and management, ranging from Agile software to spreadsheet templates. Choosing the right tool depends on your team's needs and project complexity.
Many tools offer automation and integration with task tracking systems for real-time updates.
- Jira Software: Popular Agile tool with built-in burn down chart features linked to sprint boards and issue tracking.
- Microsoft Excel or Google Sheets: Flexible spreadsheet templates allow custom burn down charts with manual or automated updates.
- Azure DevOps: Provides burn down charts integrated with work item tracking and sprint planning.
- VersionOne: Agile management platform offering detailed burn down charts and reporting capabilities.
Selecting a tool that fits your workflow helps maintain accurate and accessible burn down charts for your team.
How do burn down charts fit into Agile product management workflows?
Burn down charts are integral to Agile workflows, especially during sprint planning, execution, and review phases. They support iterative progress tracking and continuous delivery.
Teams use these charts to monitor sprint health and make informed decisions throughout the development cycle.
- Sprint planning input: Charts help estimate workload capacity and set realistic sprint goals based on past performance.
- Daily progress monitoring: Teams update charts daily to track task completion and adjust priorities as needed.
- Sprint review support: Burn down charts provide visual evidence of what was accomplished versus planned.
- Retrospective analysis: Teams analyze chart trends to identify process improvements and avoid recurring issues.
Integrating burn down charts into Agile workflows enhances transparency, adaptability, and overall project success.
Conclusion
Burn down charts are powerful visual tools that help Agile product management teams track progress and stay aligned with sprint goals. They provide clear insights into remaining work and time, enabling better planning and faster problem-solving.
By understanding how to create, use, and interpret burn down charts effectively, you can improve team collaboration, increase productivity, and deliver projects on time. Avoid common mistakes and choose the right tools to maximize the benefits of burn down charts in your Agile workflow.
What is the difference between a burn down chart and a burn up chart?
A burn down chart shows remaining work over time, while a burn up chart shows completed work against total scope. Burn up charts highlight scope changes more clearly.
Can burn down charts be used for non-Agile projects?
Yes, burn down charts can track progress in any project with measurable tasks and timelines, but they are most effective in Agile environments.
How often should a burn down chart be updated?
Burn down charts should be updated daily to provide accurate, real-time progress tracking and support timely decision-making.
What metrics are commonly used in burn down charts?
Common metrics include story points, hours remaining, or task counts, depending on the team's estimation method.
How do scope changes affect burn down charts?
Scope changes alter the total work and must be reflected in the chart to maintain accuracy and avoid misleading progress views.
Related Glossary Terms
- Stakeholder Mapping in Product Management: Strengthens collaboration and alignment across product team members.
- User Scenario in Product Management: A core product management concept for building better products and making informed decisions.
- Waterfall in Product Management: A core product management concept for building better products and making informed decisions.
%20(Custom).avif)
FAQs
What does a burn down chart show in Agile?
How do you read a burn down chart?
What are common challenges with burn down charts?
Which tools can create burn down charts automatically?
How do burn down charts benefit Agile teams?
Can burn down charts be used outside software development?
Related Terms
See our numbers
315+
entrepreneurs and businesses trust LowCode Agency
Investing in custom business software pays off
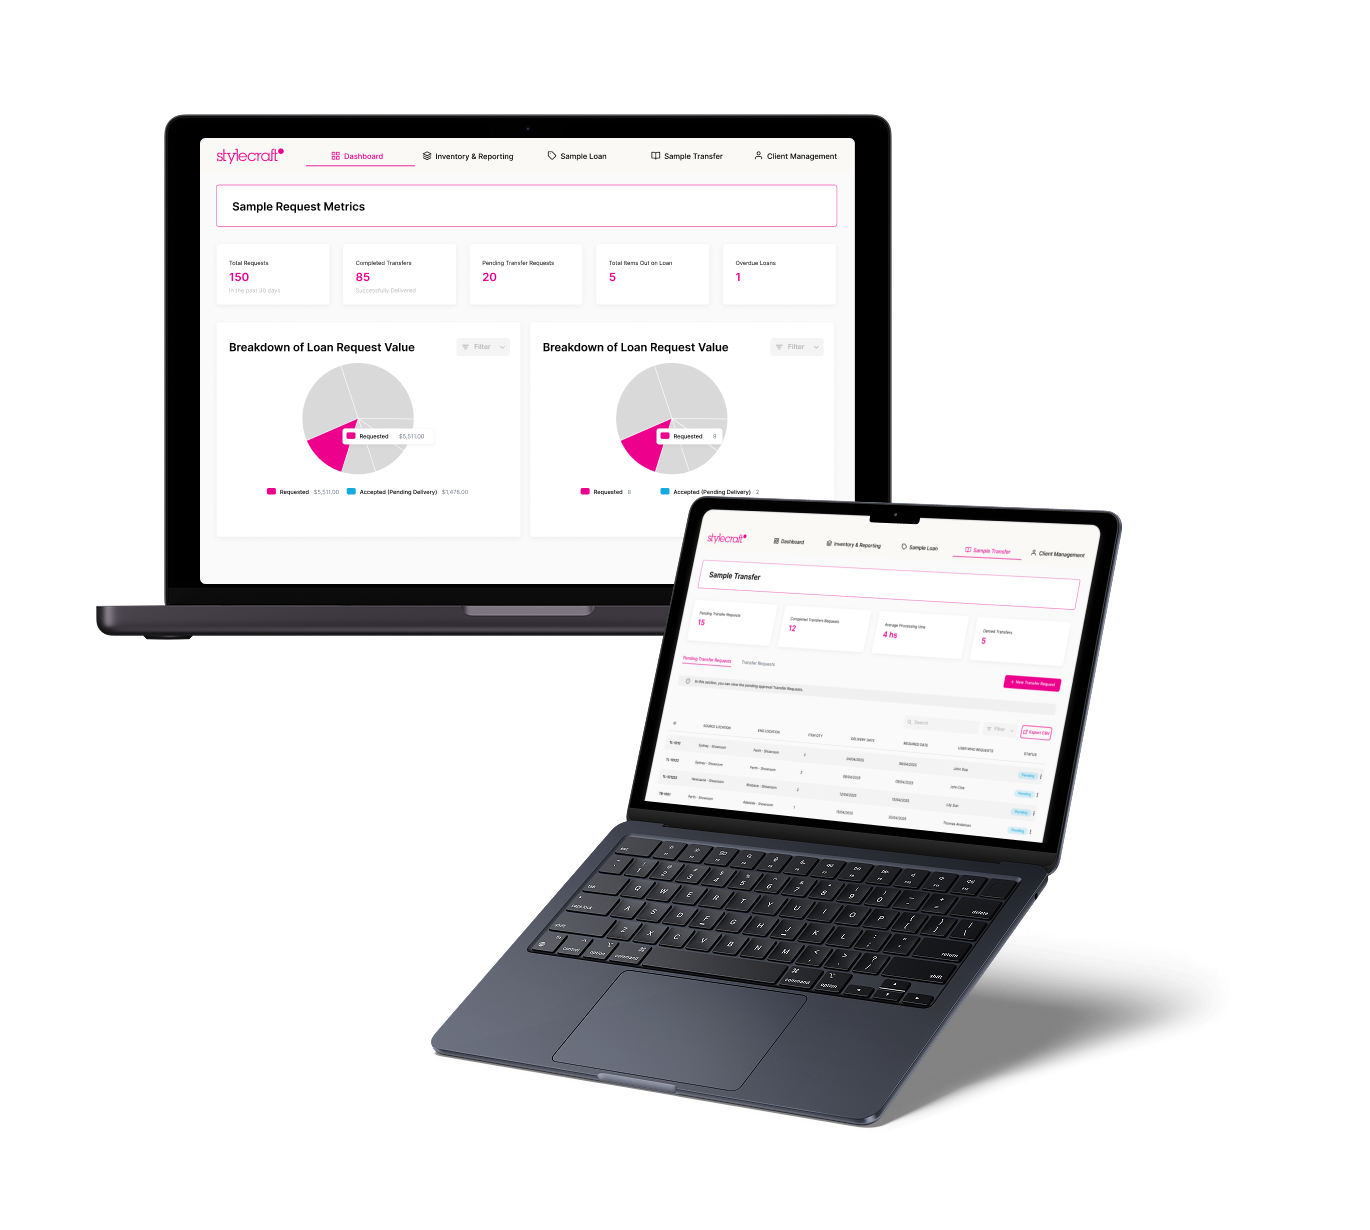
I feel like I've bought a waterfront home with a beautiful view, but I'm limited to one room. I've spent all this money on samples, but I can't see what I have.
45%
reduction in time spent locating samples
70%
increase in simultaneous project management capacity

Anthony Collins
,
Managing Director
Stylecraft