How to Build a Real Estate Analytics App with Bubble
11 min
read
Build a real estate analytics app in Bubble without coding. Visualize market trends, track KPIs, and close smarter deals with this no-code guide.


Building a real estate analytics app with Bubble lets PropTech founders and data-driven investors turn raw property data into actionable dashboards without a custom engineering team.
Most real estate decisions worth millions are still made on incomplete data. A purpose-built analytics platform fixes that without six-figure BI tool licensing fees.
Key Takeaways
- Data ingestion is the foundation: A real estate analytics app only works if property, market, and transaction data flows in reliably and stays current.
- Bubble supports chart-heavy UIs: Native chart elements and community plugins handle most visualisation requirements analytics apps demand.
- External APIs are essential: Connecting to property data providers like ATTOM or Zillow is what separates useful analytics from static dashboards.
- Role separation protects data: Analyst, client, and admin roles need distinct views enforced at the database privacy layer, not just the UI.
- Agency builds deliver faster: Complex data models with multiple external APIs are significantly harder to architect solo than with an experienced team.

What Is a Real Estate Analytics App — and Why Build It with Bubble?
A real estate analytics app aggregates, processes, and visualises property market data to support investment decisions, portfolio analysis, or market intelligence for clients.
Generic BI tools like Tableau or Power BI require separate data pipelines, IT infrastructure, and user management that PropTech startups can't maintain efficiently.
- Purpose-built user experience: Bubble lets you build role-specific dashboards for investors, analysts, and clients. Generic chart libraries on top of spreadsheets cannot match this.
- Database plus logic in one tool: Bubble handles data storage, calculation workflows, user management, and API connections without stitching together separate services.
- External API connectivity: Bubble's API Connector pulls from property data providers, mapping services, and financial feeds on a schedule or on demand.
- Faster iteration cycle: When market requirements shift, updating a Bubble analytics app takes days. Engineering sprints take weeks.
Understanding Bubble's pros and cons helps you decide which analytics features to build natively versus via an external data service or microservice.
What Features Should a Real Estate Analytics App Include?
An MVP real estate analytics app needs property search, market trend charts, an investment calculator, and user-specific saved views in one coherent interface.
Start with the features your target user checks daily - those are the workflows that must perform reliably before anything else gets built.
- Property search with filters: Users filter by location, price range, property type, yield, and size with results updating dynamically as filters change.
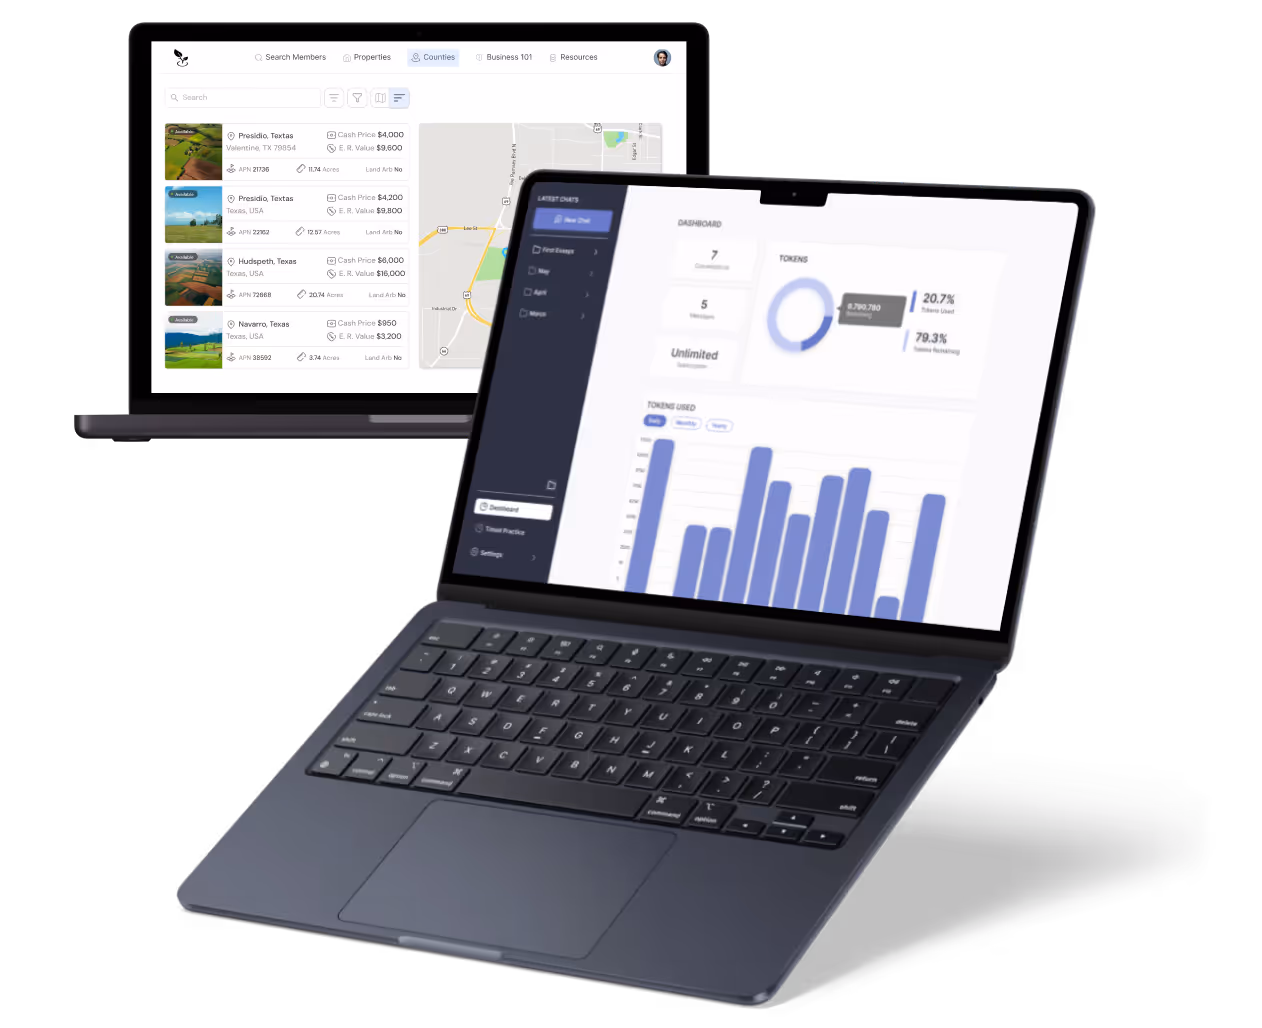
- Market trend charts: Line and bar charts show price per sqft trends, transaction volume by month, and rental yield movement across selected areas.
- Comps tool: Displays comparable sales within a user-defined radius and price range, ranked by similarity score or recency.
- Investment calculator: Computes ROI, cap rate, gross yield, and cash-on-cash return from user-input purchase price, rent estimate, and financing details.
- Map visualisation: A heatmap or property pin map shows price density, yield concentration, or transaction activity by geographic area.
- Saved searches and watchlists: Users save filter combinations and specific properties to monitor; the app re-runs searches on load to surface new matches.
- Report generation: Exports filtered property data and charts as a branded PDF report for client presentations or investment committee reviews.
- Role separation: Admin, analyst, and client roles each access a different subset of features and data fields based on their subscription or permission level.
Clear feature scoping prevents analytics apps from becoming bloated dashboards that try to do everything and excel at nothing.
How Do You Structure the Database for a Real Estate Analytics App in Bubble?
The data model needs seven types: Property, Market Snapshot, Saved Search, Watchlist Item, Report, User, and optionally a Data Source record for tracking API ingestion.
Relationships between properties, areas, and users drive every query, chart, and filter in the app. They must be correct before any UI is built.
- Property: Fields include address (text), postcode/zip (text), price (number), size in sqft (number), property type (option set), bedrooms (number), transaction date (date), and rental yield (number).
- Market Snapshot: Fields include area identifier (text), average price (number), median yield (number), transaction count (number), snapshot date (date) - one record per area per day.
- Saved Search: Fields include name (text), filter parameters stored as JSON text, owner (User), and last executed date (date).
- Watchlist Item: Fields include linked Property (Property), date added (date), notes (text), and owner (User) - strictly one user per record.
- Report: Fields include generated date (date), included properties (list of Property), PDF file (file), filters description (text), and created by (User).
- User: Fields include role (option set: admin/analyst/client), subscription tier (option set), and organisation name (text).
For high-volume property datasets with millions of records, evaluating the best backends for Bubble helps you decide whether Bubble's native database is sufficient or whether Xano or Supabase is a better fit.
How Do You Build the Core Workflows for a Real Estate Analytics App in Bubble?
Core workflows handle data ingestion from external APIs, market snapshot calculations, investment computations, saved search execution, and PDF report generation.
Backend API workflows running on a schedule are the backbone of any analytics app. They keep data fresh without requiring user-initiated actions.
- Data ingestion workflow: A scheduled backend workflow runs nightly, calling the external property data API via Bubble's API Connector and creating or updating Property records based on a unique listing ID.
- Market snapshot calculation: After ingestion, a second scheduled workflow groups Property records by postcode, calculates averages, and writes one Market Snapshot record per area.
- Investment calculator: A client-side workflow uses custom states to compute ROI, cap rate, and gross yield in real time from input fields - no server round-trip needed for basic calculations.
- Saved search execution: On page load of the search view, a workflow reads the User's Saved Search record, extracts the stored filter parameters, and populates the search query dynamically.
- Watchlist add: A single-action workflow adds the selected Property to the User's watchlist list field when the user clicks the save button.
- Report generation: A backend workflow collects the filtered Property list, passes records to the PDF plugin, generates the file, and saves it to a new Report record linked to the User.
- Price alert workflow: A scheduled workflow compares today's Market Snapshot values to the prior snapshot; if price delta exceeds a user-set threshold, it triggers a SendGrid email notification.
Each scheduled workflow should include error handling steps that log failures to a dedicated Error Log data type so you can diagnose ingestion problems without reviewing server logs manually.
What Security and Data Requirements Apply to a Real Estate Analytics App?
Privacy rules must gate premium data fields by subscription tier and restrict personal reports to their creator. These controls belong at the database level.
An analytics app where any user can query any property record or download any report is a liability, not a product.
- Premium field gating: The Property data type privacy rule exposes basic fields (address, type, price) to all authenticated users, but restricts yield, transaction history, and comparable data to users with an analyst or admin subscription tier.
- Report access control: The Report privacy rule restricts file access to "Current User is this Report's created by field OR Current User's role is admin" - no sharing by default.
- Watchlist scoping: Watchlist Item records are only visible to the User field linked to that record - prevents any cross-user data leakage in search queries.
- API key protection: All external property data API keys and Mapbox tokens are stored in Bubble's server-side environment settings and accessed only in backend workflows - never in client-side calls.
- Subscription gating workflow: Before running a premium analytics query, a workflow step checks the User's subscription tier field and returns an error state if the tier does not permit access.
Test privacy rules against a test user account with no subscription before launching. Most data leaks in analytics apps come from misconfigured privacy rules, not hacking.
What Plugins and Integrations Does a Real Estate Analytics App Need?
An analytics app needs charting plugins, a mapping library, an external property data connection, PDF generation, and subscription management as core integrations.
Validate each plugin works with your data structure before committing. Some charting plugins have limitations on dynamic data sources or update frequency.
- Bubble Chart Element (native): Handles line charts, bar charts, and basic scatter plots for market trend views; adequate for most MVP analytics requirements.
- Apexcharts for Bubble: Community plugin providing advanced chart types including heatmaps, candlestick charts, and drill-down bar charts beyond native Bubble capabilities.
- Leaflet.js or Mapbox plugin: Powers property pin maps and choropleth area shading for geographic analytics views.
- API Connector (native): Connects to ATTOM Data Solutions, Zillow API, Rightmove Data Services, or a custom property feed via authenticated REST calls.
- Air PDF Conjurer or DocuPDF: Generates branded analytics reports as professionally formatted PDFs from dynamic Bubble data.
- Stripe plugin: Manages analyst and client subscription tiers with recurring billing, plan upgrades, and webhook-triggered permission updates.
- SendGrid plugin: Delivers price alert emails, report download links, and subscription confirmation messages with custom templates.
- Google Sheets or Airtable sync: Allows clients to export property datasets for further analysis or integration with their own internal tools.
A leaner plugin stack is easier to maintain. Only add a plugin if no native Bubble feature or API Connector call can achieve the same result.
How Long Does It Take and What Does It Cost to Build a Real Estate Analytics App with Bubble?
Build time ranges from 12 weeks for a basic manual-input analytics MVP to 28 weeks for a full market intelligence platform with automated data feeds and white-label client reports.
Data pipeline reliability is the variable most solo builders underestimate. External API dependencies add significant testing and maintenance overhead.
- Solo MVP build: 12 to 16 weeks at 200 to 300 hours; covers manual property input, basic investment calculator, chart dashboards, and a single user role.
- Agency build with external data APIs: 10 to 14 weeks with a team; includes automated nightly data ingestion, map integration, subscription gating, and a comps tool.
- Full market intelligence platform: 20 to 28 weeks; adds multi-region data coverage, white-label client reports, advanced heatmaps, and automated alerts at scale.
- Bubble plan recommendation: The Team plan at $349/month is needed for analytics workloads; the higher server capacity handles scheduled backend workflows and complex search queries without timeouts.
- ATTOM Data API: Starts at approximately $200/month for commercial access to property transaction and market data across the US.
- Mapbox pricing: Free tier covers 50,000 map loads per month; scales to $0.50 per 1,000 requests beyond that threshold.
- Stripe subscription fees: Standard 2.9% plus 30 cents per transaction; recurring billing via Stripe Billing adds a 0.5% platform fee on managed subscriptions.
Analytics-heavy apps run more server-side processes than typical Bubble builds, so review Bubble's pricing plans to ensure you match the right capacity tier to your scheduled workflow volume.
Conclusion
Bubble enables PropTech founders to build a custom analytics platform that replaces expensive BI licensing with role-specific dashboards and live property data.
Lock down the data model, external API reliability, and subscription access gating before building any UI. Every other decision depends on those three elements being correct.
Need Help Building Your Real Estate Analytics App on Bubble?
External data pipelines break silently when API contracts change. Subscription gating misconfigured at the privacy layer exposes premium property data to free-tier users.
At LOW/CODE Agency, we build AI-powered products for SMBs — custom web apps, mobile apps, chatbots, RAG systems, and AI agents, delivered with the depth and standards of a specialist software team. We scope the architecture, engineer the workflows, and stay involved through launch and beyond.
- Data architecture: We design your data types, option sets, and privacy rules before writing a single element on the canvas.
- Workflow engineering: We build backend workflows, scheduled jobs, and API integrations with proper logic and error handling.
- Plugin configuration: We select and configure the right Bubble plugins for your feature set without unnecessary bloat.
- Role-based access: We implement privacy rules at the database level, not just conditional UI visibility.
- Integration setup: We connect your Bubble app to Stripe, SendGrid, Twilio, and other services correctly from day one.
- Pre-launch testing: We test against real data before deployment so every workflow performs correctly under live conditions.
- Post-launch support: We stay involved after go-live to optimize as real usage data shapes the app.
We have built 350+ products for clients including Coca-Cola, American Express, Sotheby's, and Medtronic. We know exactly where Bubble builds fail and we address those problems before they surface.
Related Articles
- How to Build a Real Estate Marketplace App with Bubble
- How to Build a Real Estate Investment Tracker App with Bubble
- How to Build a Real Estate Deal Tracker App with Bubble
- How to Build a Quiz Platform App with Bubble
- How to Build a Quality Inspection App with Bubble
- How to Build a Purchase Order Management App with Bubble
Last updated on
July 4, 2026
.

Jesus is a visionary entrepreneur and tech expert. After nearly a decade working in web development, he founded LowCode Agency to help businesses optimize their operations through custom software solutions.


FAQs
Can you build a real estate analytics app without coding using Bubble?
How do you aggregate market data in a Bubble real estate analytics app?
How do you visualize price trends in a Bubble real estate analytics app?
How do you calculate investment metrics in a Bubble real estate analytics app?
How do you compare neighborhoods in a Bubble real estate analytics app?
How do you set up market alerts in a Bubble real estate analytics app?
Related Articles

Bubble
What is Bubble.io? | Features, Limits & Alternatives (2026)
Read our Bubble.io review covering key features, limits, pricing factors, and top alternatives to help you decide if Bubble fits your app in 2026.

Bubble
How to Build a Litigation Management App with Bubble
Manage litigation smarter with a no-code Bubble app. Track cases, deadlines, and documents without coding your step-by-step guide starts here.

Bubble
How to Build a Deal Tracker App with Bubble
Build a deal tracker with Bubble. Visualize your pipeline, log every interaction, and never lose track of a deal — no code, no bloated CRM.

Bubble
How to Build a Petition Platform App with Bubble
Build a petition platform app with Bubble without coding. Collect signatures, grow campaigns, and drive change fast using this no-code step-by-step guide.